 The financial services industry and in particularly the investment and portfolio management sub-field has a quite a few industry specific terms. As a group, financial professionals tend to think most people who are not in our industry understand many of terms we use so freely - which of course isn't necessarily true. So I've attached a link to a great resource of financial glossary terms provided by YCharts.com. If you are an avid financial reader or DIY investor you might want to book mark this page, and then when you come across a term you aren't sure about, you'll now have a way to bring yourself up to speed. The link is at the very end of this article. From the several hundred definitions provided, here are a couple of examples, taken directly from the financial glossary (Altman Z-Score and Beta) at YCharts.com: ALTMAN Z-SCORE CAUTION: The Altman Z-Score is meant to be applied only to manufacturing firms that are near bankruptcy. It was not based on a sample including non-manufacturing firms (service firms, banks, etc.). Use it at your own risk with those companies, but beware that bankruptcy probabilities may be misstated. The Altman Z-Score helps investors to gauge the probability of a company going bankrupt. Generally, firms with a score above 3.00 have a low probability of bankruptcy, and those with a Z-Score of less than 1.81 have a relatively high probability of bankruptcy. Note that this is a probabilistic model, so it will not classify perfectly. The score was first published in a 1968 paper by Edward Altman titled "Financial Ratios, Discriminant Analysis and the Prediction of Corporate Bankruptcy." Altman re-tested the model in a 2000 paper titled "Predicting financial distress of companies: Revisiting the Z-score and Zeta models". The paper showed that the model still had utility for looking at manufacturers, though the number of misclassifications did increase over time. FormulaZ = 1.2 x (Working Capital / Total Assets) + 1.4 x (Retained Earnings / Total Assets) + 3.3 x (Earnings Before Interest and Taxes / Total Assets) + 0.6 x (Market Value of Equity / Total Liabilities) + 1.0 x (Sales / Total Assets) Where: Working Capital = Current Assets - Current Liabilities Market Value of Equity = Market Cap + Preferred Stock BETA Beta is a measure of the risk of a stock when it is included in a well-diversified portfolio. In financial theory, the Capital Asset Pricing Model (CAPM) breaks down expected stock returns into two components. The first is the return that would be expected based on covariance with the movements of the market (for most stocks, when the market as a whole goes up, the price of the stock will also go up). This is considered systematic risk. The second part is the increase in the price of a stock that is not explained by the market (nonsystematic risk). The first part - covariance with the market - is what Beta captures. When Beta is positive, the stock price tends to move in the same direction as the market, and the magnitude of Beta tells by how much. If a stock's Beta is greater than 1, that means that when the market index goes up 1%, we expect the stock will go up by more than 1%. On the contrary, if the market goes down by 1%, we expect the stock to go down by more than 1%. Negative betas signify a negative correlation. When the market goes up, a stock with a negative beta would be expected to go down. For readers with a background in regression analysis, Beta is the slope of the linear regression shown in the formula below, where Returns are the return on an individual stock or portfolio, R_f is the risk free rate, R_Market is the return on a market portfolio, and e is an error term. So take a look around and enjoy a great resource from the YChart.com website. Click the link below. -Paul R. Rossi, CFA Financial Glossary (ycharts.com)
0 Comments
 So, it’s that time of year (again). In the spirit of making predictions that will actually come true, here are our Top 10 predictions in order of certainty. In other words, Prediction #10 is pretty-darn-certain to happen while Prediction #1 is absolutely guaranteed.
#10. Stock Market Volatility Will Continue The stock market, the bond market, the commodities markets, the geopolitical landscape, pretty much all endeavors where people are involved are volatile – some more than others. This is a feature not a bug. #9. Sectors Will Rotate The S&P 500 has eleven sectors (technology, financial, real estate, health care, etc.), and guess what? Various sectors fall in and out of favor and therefore their returns will be all over the map. Market prognosticators will give a reason as why this happened...but always after-the-fact. #8. Congress Will Continue To Be a Lightning-Rod Why? Because 535 people come from all over the country having all different agendas. However, the one agenda they all share is wanting to get reelected. #7. The Business Media Will Continue To Talk About What The Fed Is Going To Do Next Economists enjoy talking about when the Fed is going to lower or raise short-term interest rates. Why? Because it gives people the idea that some so called experts know what the Fed is going to do - the secret is, they don't. Predicting almost anything related to the economy is next to impossible. My advice is to get comfortable being uncomfortable. #6. There Will Be Earnings Disappointments Some companies will do worse than expected. Some will even go out of business. Some will disappoint and then surprise in the future. #5. There Will Be Earnings Surprises Some companies will do better than expected. Some of these companies will buy other companies. Trying to predict which companies will continue to do well is harder than understanding quantum mechanics. Capitalism is fierce, tread lightly. #4. The Housing Market Will Change Mortgage rates, lending standards, building permits, and employment all effect the housing market, and these 4 inputs are always changing so it’s nearly impossible for housing not to change. #3. The U.S. Dollar Will Fluctuate Many factors affect the movement of the U.S. dollar and it's virtually impossible to predict the direction, but many will try. Don’t be one of them. #2. Patient Long-Term Investors with a Well-Thought Out Plan Will Do Well Past performance of course will not guarantee future results, but it is a pretty-good indication of what the range of outcomes will likely be. #1. My team Will Continue To Serve You In a Fiduciary Capacity As always, we believe that making decisions based on evidence rather than predictions will give you the best odds of success. Together, we will help plan, build, and execute a financial roadmap that will allow you to live on purpose. And that is one prediction that is absolutely guaranteed. -Paul R. Rossi, CFA Founded in 1892, General Electric has been around for over 128 years and the company has built and produced an amazing array of products from light bulbs, to jet engines, to magnetic resonance Imaging (MRI) machines, and almost everything in between during various periods of time. Understandably, many business school students and investors have studied, analyzed, and marveled over GE's long-term success. You can see below that a $10,000 investment in GE back in 1981 grew to almost $600,000 in less than 20 years. This is truly an amazing record and something very few companies achieve. In fact, the +20% annualized returns that GE produced over that time period are very similar to the returns Apple has produced from 2000-2020. Quite astounding to say the least. 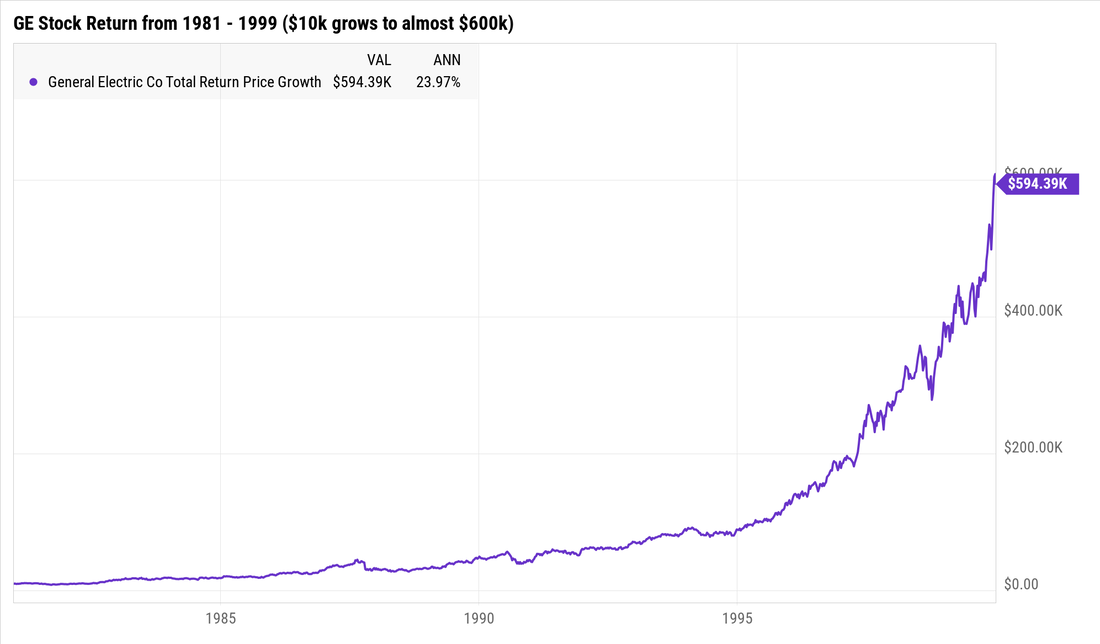 But even with all its success, both for consumers and its shareholders, no company is immune to the extremely competitive business world. Like every global company today, GE competes in the most competitive arena the world has to offer, that arena is called Capitalism. Capitalism is fierce. And as such, the story changes dramatically for people who invested in GE anytime over the last 20 years. See the chart of GE below (2000 - 2020). GE has been dead money for two decades. Especially if you review how well the overall stock market performed during that same time period. $10,000 invested in GE back in 2000, an investor lost a whopping 7,400, leaving only $2,600. During this same time period, that same $10,000 invested the overall stock market grew to over $30,000. 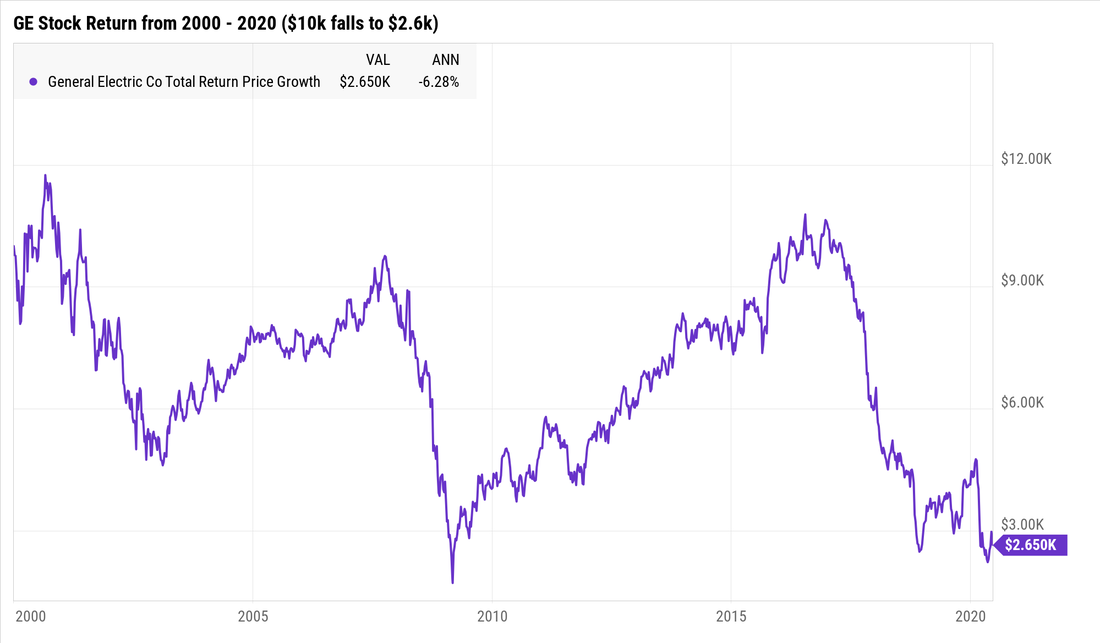 As much as you, stock market analysts, Forbes, or your neighbor loves a particular company, even the most successful companies, some with 100+ year old track records might not provide good returns going forward. Sometimes history isn't a guide to the future and back in 2000 it wasn't for GE.
Understanding where a company competes, what are its biggest threats, what the business landscape looks like, determining their competitive advantage, answering another 100 or so difficult questions, and then properly being able to determine its value is paramount to having a chance of investing success. Ask yourself, back in 2000 after GE's amazing growth, wouldn't you have thought GE would continue to do well for the next 20 years? Competition is fierce, tread lightly. |