|
There is a reason why the vast majority of individual investors shouldn't own individual stocks. Lots and lots of companies don't do well, in fact, many can make horrible investments and some even go out of business. Buyer beware. Below is a 5-Year Chart of the 11 Worst Performing Stocks in the S&P 500 - while many other companies lost money over this same time period, in fact, 145 were money losers over the last 5-years. Or said another way, almost 1/3 of all companies in the S&P 500 index lost money over the last 5-years! The purple line is the S&P Index over the same time period. Basically over the last 5-years, which includes the current Covid crisis, the stock market is up over 61%, while many companies didn't fair nearly as well. 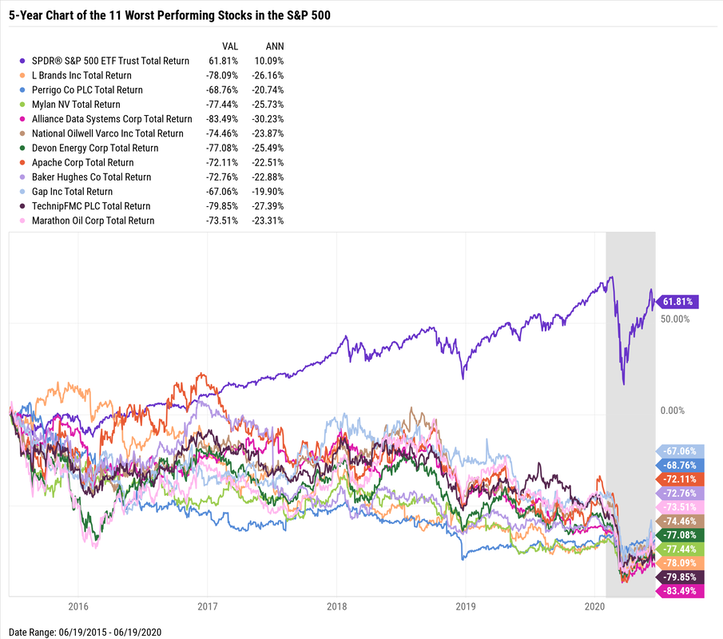 And it gets worse if we look at the Russell 3000 Index, which incorporates somewhat smaller companies that the S&P 500 doesn't include. However, these are still large companies with well-known names. Names like: Macy's, GNC, GoPro, Tupperware, just to name a few. 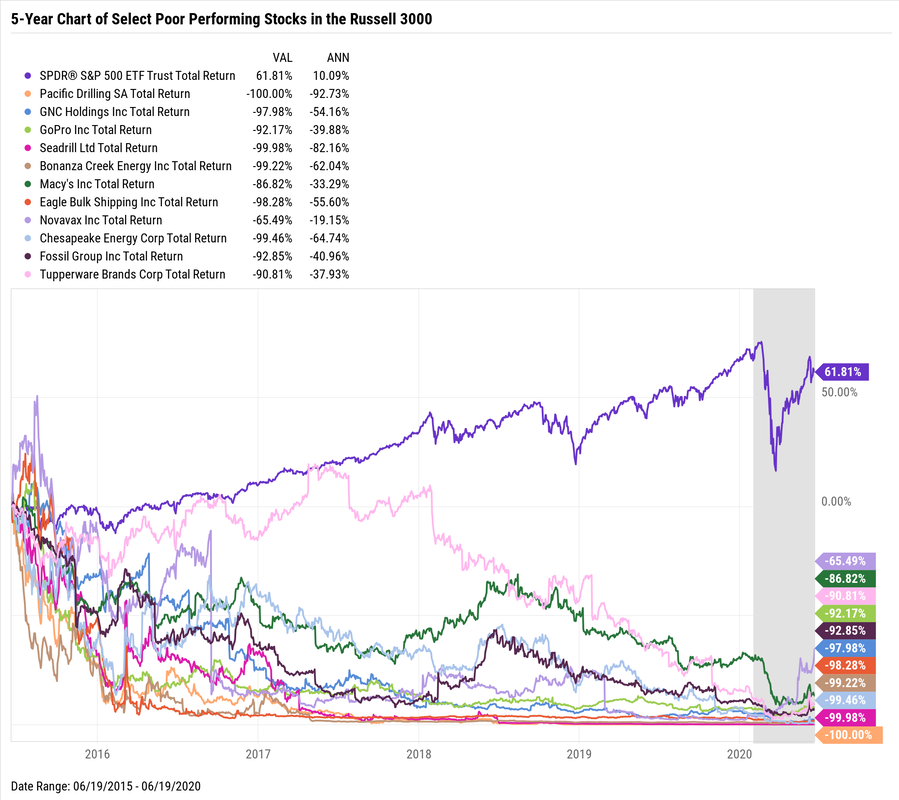 Picking individual stocks isn't easy, nor should it be. This is a highly competitive field, filled with lots of very smart highly skilled professionals who get paid large sums of money to correctly analyze companies and make money for their investors.
Every time you place a trade to buy a company's stock, you should consider who is on the other side of your trade...and what is it that they know, that you don't know? Buyer beware.
0 Comments
So, in the spirit of making predictions that will actually come true, here are my Top 10 predictions in order of certainty. In other words, Prediction #10 is pretty-darn-certain to happen while Prediction #1 is absolutely guaranteed.
#10. Volatility will remain The stock market, the bond market, the commodities markets, the geopolitical landscape, pretty much all endeavors where people are involved are volatile – some more than others. This is a feature not a bug. #9. Sectors will rotate The S&P 500 has eleven sectors (technology, financial, real estate, health care, etc.), and guess what? Various sectors fall in and out of favor and therefore their returns will be all over the map. Market prognosticators will give a reason as why this happened...but always after-the-fact. #8. Congress will continue to be a lightning-rod Why? Because 535 people come from all over the country having all different agendas. However, the one agenda they all share is wanting to get reelected. #7. The business media will continue to talk about what the Fed is going to do next Economists enjoy talking about when the Fed is going to lower or raise short-term interest rates. Why? Because it gives people the idea that some so called experts know what the Fed is going to do - the secret is, they don't. Predicting almost anything related to the economy is next to impossible. My advice is to get comfortable being uncomfortable. #6. There will be earnings disappointments Some companies will do worse than expected. Some will even go out of business. Some will disappoint and then surprise in the future. #5. There will be earnings surprises Some companies will do better than expected. Some of these companies will buy other companies. Trying to predict which companies will continue to do well is harder than understanding quantum mechanics. Capitalism is fierce, tread lightly. #4. The housing market will change Mortgage rates, lending standards, building permits, and employment all effect the housing market and these 4 inputs are always changing so it’s nearly impossible for housing not to change. #3. The U.S. dollar will fluctuate Many factors affect the movement of the U.S. dollar and it's virtually impossible to predict the direction, but many will try. Don’t be one of them. #2. Patient long-term investors with a well-thought out plan will do well Past performance of course will not guarantee future results, but it is a pretty-good indication of what the range of outcomes will likely be. #1. My team will continue to serve you in a fiduciary capacity As always, we believe that making decisions based on evidence rather than predictions will give you the best odds of success. Together, we will help plan, build, and execute a financial roadmap that will allow you to live on purpose. And that is one prediction that is absolutely guaranteed. The Coronavirus Bear kicked the 11-year Bull Market of Wall Street very fast. A “bear market” occurs when stock prices in general are falling, and then widespread pessimism sustains the continued drop in prices. The stock market becomes a bear market whenever stock prices have fallen over 20% over the course of several months, as seen in market indexes like the S&P 500. Investors lose confidence in the market as they anticipate further losses.
A “bull market”, on the other hand, comes with rising stock prices and increasing investor confidence. Stock prices rise by at least 20% over the course of several months in a bull market. Looking at history, bear markets are typically shorter than bull markets. A bull market's average duration is about 3 years, while bear markets last on average about 18 months. The terms, “bear market” and “bull market,” come from the behaviors of these animals: A bull thrust its enemies upward, while a bear prefers to knock foes into the dirt. Stock Market Corrections It is important to distinguish a bear market from a market correction, which is shorter and involves less of a market decline. Market corrections are part of the normal ebb and flow of the market. They are short-term trends that typically last less than two months and involve stock market declines of about 10% - not the 20% fall in a bear market. Stock market corrections are a natural part of the stock market cycle. Stock Market Crashes Stock markets “crash” when stock prices plummet more than 10% in one day. The Great Crash of 1929 consisted of market drops of 13% and 12% on successive days. On March 16, 2020, the market crashed 13%. Bear Market Rally In a normal bear market, there will of course be days or weeks when prices increase. It is important, however, to distinguish a bear market rally from the beginning of a bull market. In a rally, the stock market posts gains for days or even weeks in a row. Investors might be tricked into thinking that a new bull market has begun. However, until stock prices increase by 20%, there is still a bear market. Recessions A recession occurs when the Gross Domestic Product (GDP) declines for two or more quarters in a row. Many of the same factors cause recessions and bear markets, but the stock markets and the economy do not always move together. Usually, however, a bear market and a recession overlap. Historical Bear Markets: Great Crash of 1929 (89% drop, 34 months) The depression was preceded by the Great Crash of October, 1929, with price declines of 13% and 12% on successive days. The crash also inaugurated the worst bear market of all time, with stocks dropping 89% through June, 1932. High unemployment lasted through the 1930s. Vietnam & Assassinations of 1968-1970 (36% drop, 18 months) A weakening economy, high inflation, a tumultuous year of assassinations and riots, and tensions of the Vietnam War influenced the development of a bear market, which accompanied a mild recession. Oil Embargo of 1973-1974 (48% drop, 21 months) The 1970s were marked by chronically high inflation. Stocks also underperformed during the decade, rallying and then fading in value. In 1973, the Arab oil embargo drove up gas prices, sparking double-digit inflation, a recession, and a bear market. Interest Rate Rise in 1980-1982 (28% drop, 21 months) By 1980, the country had faced almost a decade of sustained inflation, along with slow growth. In order to fight this “stagflation,” the Federal Reserve raised interest rates. This rate increase, coupled with a deep recession, led to a relatively shallow bear market lasting 21 months. Crash of 1987 (34% drop, 3 months) Due in large part to the excesses of automated computer trading, the market crashed, falling 22.6% in one day. The resulting bear market lasted only a brief 3 months. The GDP did not fall, so there was no recession. Dot.com Bubble of 2000-2002 (49% drop, 30 months) The Dot.com bubble consisted of soaring stock prices and excitement about newly emerging Internet companies. The bubble burst when investors realized that the newly emerging Internet companies showed little or no profit. The attacks of 9/11 deepened a mild recession and prolonged this bear market. Subprime Mortgage & Financial Crisis of 2007-2009 (56% drop, 17 months) A rising mortgage delinquency rate spilled over into the credit markets because a variety of financial instruments were tied to home loans. As a result, the U.S. and other countries enacted large economic stimulus measures. It was accompanied by the “Great Recession.” The Coronavirus of 2020 (30%+ drop, TBD) The pace with which the bear kicked the bull off of Wall Street was startling, as markets were setting record highs as recently as mid-February 2020. In fact, the speed with which the bear awakened from its 11-year slumber was the fastest in history. Volatility was rampant, the NYSE’s circuit breakers kicked on multiple times and the U.S. government rushed through aid packages worth over $1 trillion. A bear market is difficult to predict. Falling stock values might just be part of a stock market correction. Rising values might only signal a bear market rally, as opposed to a new bull market. Investors need to beware of the tendency to overreact to fears of a bear market or thrills of a bull market. Investors tend to tinker with their holdings, often selling after stocks have fallen sharply, instead of buying stocks at low prices (or buying after stocks have risen to unsustainable heights). Similarly, some investors sell stocks before the bear market begins but are then too frightened to return. Many factors affect the stock market. The depression was preceded by the Great Crash of October, 1929, with price declines of 13% and 12% on successive days. The crash also inaugurated the worst bear market of all time, with stocks dropping 89% through June, 1932. High unemployment lasted through the 1930s. The pace with which the bear kicked the bull off of Wall Street was startling, as markets were setting record highs as recently as mid-February 2020. In fact, the speed with which the bear awakened from its 11-year slumber was the fastest in history. Volatility was rampant, the NYSE’s circuit breakers kicked on multiple times and the U.S. government rushed through aid packages worth over $1 trillion. Trends and Predictions Bull markets feature investor optimism, but this turns to pessimism and panic during a bear market. Both bull and bear markets are driven by changes in investor attitudes as much as by economic fundamentals. Target Date Funds have become wildly popular in retirement plans over the last few years, and rightfully so, they help investors who don’t necessarily have a great understanding of investing or don’t have the time, the commitment, nor the energy to put toward researching and understanding how they should be invested. What is a Target Date Fund? It's a prebuilt portfolio that uses one input to determine how to invest your money. What's the one input? The date you expect or plan to retire. That's it. Is this really the best way to plan for your retirement? Probably not, but it's better than having your retirement money sitting in cash or your retirement plan's money market option. Long-term, cash and cash-like investments actually lose their value or purchasing power due to inflation (read here about inflation), so it's important to get your money invested. So Target Date Funds can help people get started in their journey to financial independence if they aren't sure what to do and want to get their feet wet investing. However, to have the highest probably of financial success, the following questions should be addressed and understood prior to making any investment decisions:
While Target Date Funds won't help answer the questions above, they can help people who at least want to get their retirement going and don't know where to start. Generally I agree that picking a Target Date Fund over the default money market option in most retirement plans is a pretty good start, but it’s definitely not the finish line, and quite honestly, it's closer to the starting line. Target Date Funds with the same target date have dramatically different returns over various time. Understanding how these target date funds are invested, what they’re invested in, how often they re-balance and the expenses they charged is critical to understand. Why? Well, this will determine how your portfolio will do overtime and how much money your portfolio may be worth in 10, 20, or 30 years in the future. Take a look at two charts below of many well-known Target Date Funds that all supposedly have the same retirement date. Notice the difference between returns and how volatile various target date funds can be even with the same retirement date of 2030. The below chart shows several 2030 Target Date Funds and how they faired during this recent downturn. They ranged from being down as little as -22% to down over -28% from their recent highs. 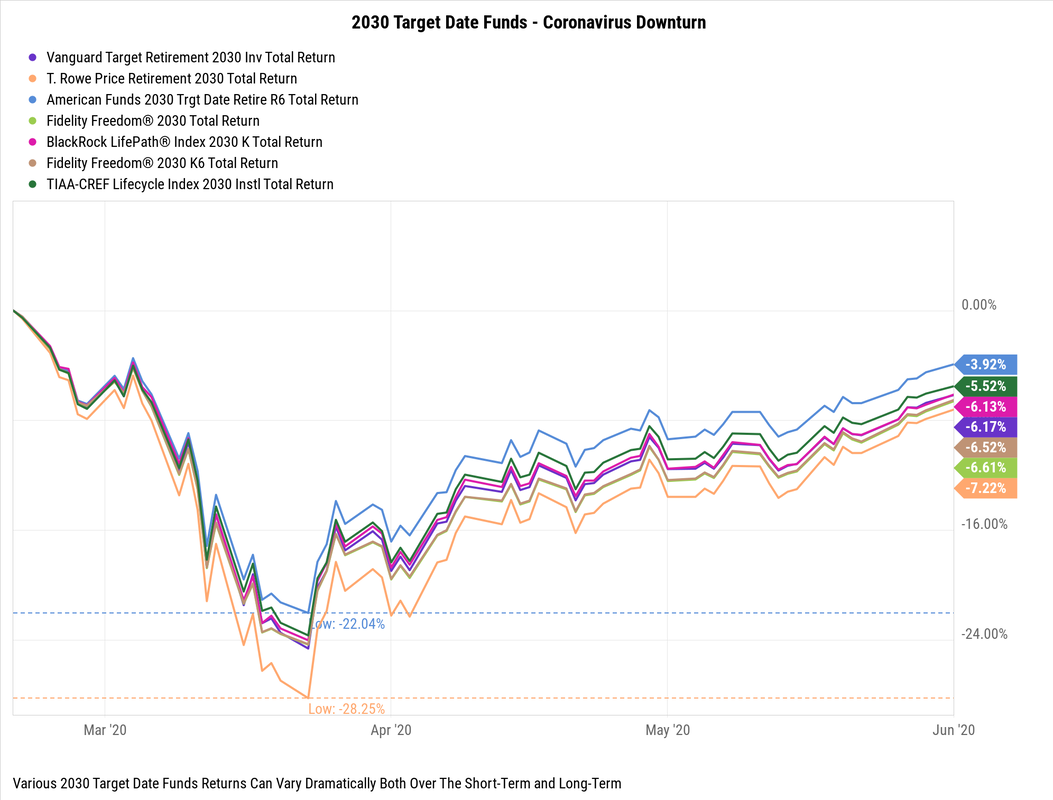 The chart below shows the 10-Year return of these same seven 2030 Target Date Funds. The returns differences are staggering, if you had invested $100,000 10-year ago your value today would have ranged from $178,000 to over $211,000 depending which Target Date Fund you might have been invested in. 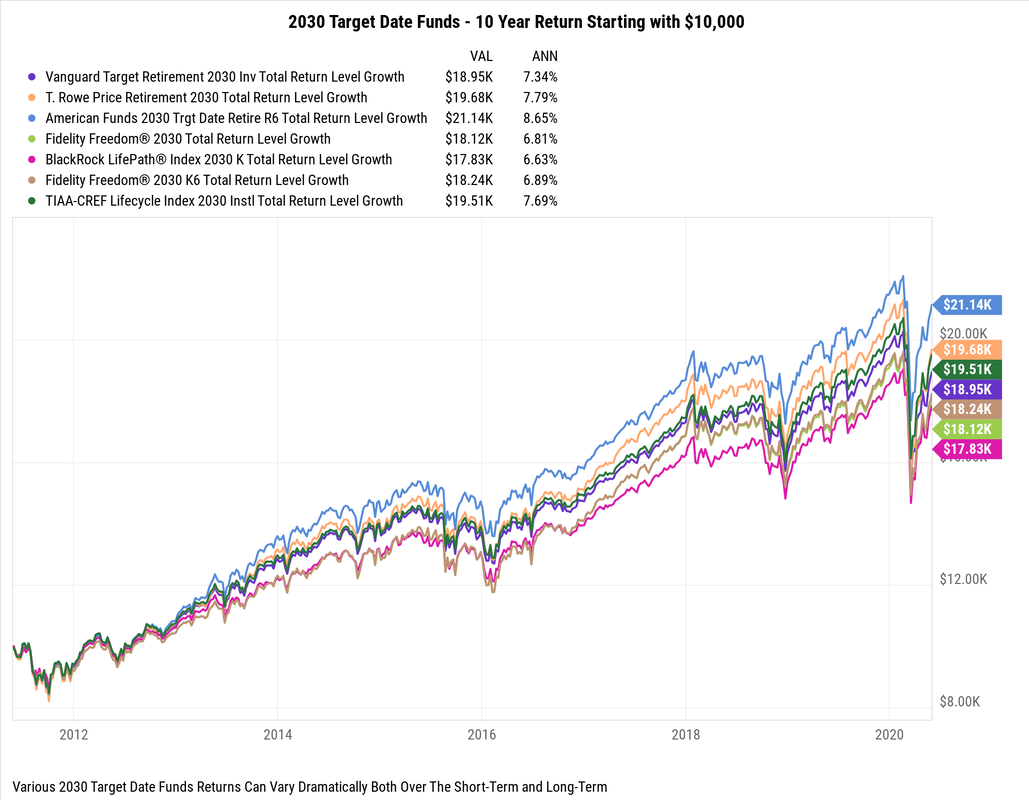 Having a well-though financial plan, understanding what you are invested in (research, research, research & more research), and recognizing not all Target Date Funds are created equal is important to meeting your financial goals.
|