 Let’s break down the metrics and details used that every person who invests in their company’s retirement should pay attention to.
By identifying and understanding these metrics for evaluating funds, you are one step closer to finding the best funds to invest in to help you reach your financial goals. -Paul R. Rossi, CFA
0 Comments
For a lot of investors, when you bring up the term "FAANG," they understand what you are referring to, as the term has become quite ubiquitous. The term FAANG refers to the stocks of: Facebook (Meta) Apple Amazon Netflix It can be argued that these five companies have changed the way we work, live, and communicate. They have changed our lives in so many ways...and along the way investors have done quite well (mostly). But like most things, it depends how we measure returns, or more accurately how long has an investor has owned these companies. Investors get dramatically different answers to the question, "How well are these companies doing?" depending on the time period they are measuring. Let's review how well they've done over the following time periods:
Short answer is, they are Up, Down, Down, Up, Up, and Way Up. 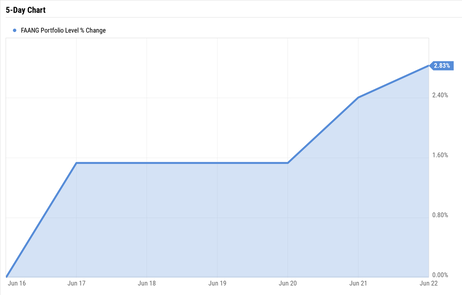 5-Day Return: UP 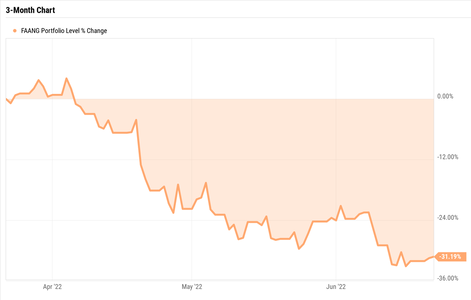 3-Month Return: DOWN 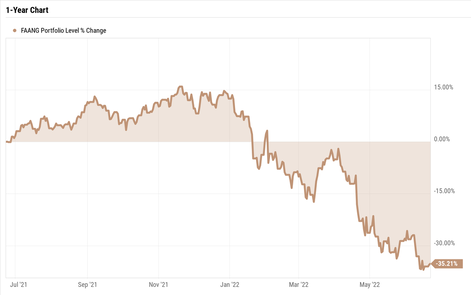 1-Year Return: DOWN 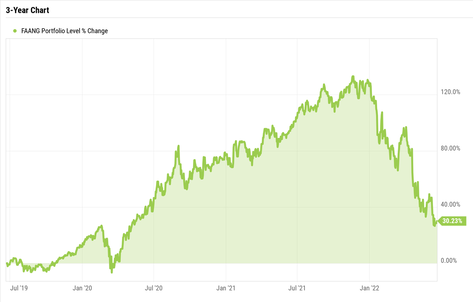 3-Year Return: UP 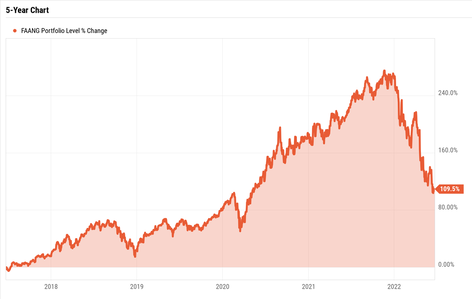 5-Year Return: UP 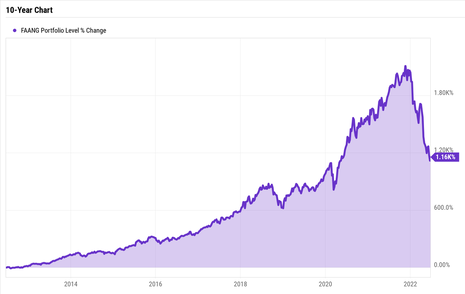 10-Year Return: WAY UP Investors have been handsomely compensated over the last 10-years, gaining more than 10x their original investment. And during the last several years the P/E Ratio (a valuation metric) has been coming down on these companies collectively (chart below). This is good news for investors. New investors are now able to buy these companies at valuation levels never seen before. 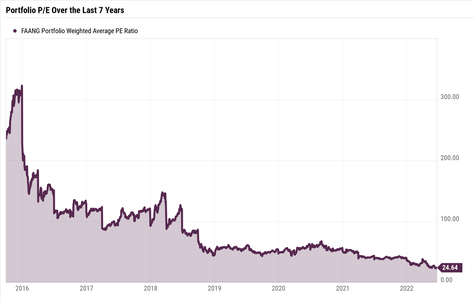 What's interesting is that many other companies and their corresponding stock have similar patterns, over the short-term they tend to be up and down quite a bit. The next time you hear the old adage, "What goes up, must come down." You can ask them, "Over what time period?" -Paul R. Rossi, CFA Financial professionals rely on long-term historical averages when making capital market assumptions and not all starting points are the same. Investors should take current stock valuations into account as they make financial plans and allocate assets. Getting into the market when stocks are highly valued can work against an investor. Even over time horizons as long as 20 years or more investing in high valuation environments can lead to below average returns. Conversely if stock valuations are low when the investor begins, this can lead to above average returns over an economic cycle. Even young investors with long time horizons should be mindful not to assume too much risk in an overvalued market even if the long-term return eventually averages out to what was initially anticipated. Lets take a look at an interesting situation between historical growth rates and a well-known valuation metric used by financial professionals called the P/E ratio. The ubiquitous P/E ratio, which is defined as the (Price per share) / (Earnings per share). The P/E ratio has units of years, which can be interpreted as the number of years of earnings to pay back purchase price. P/E ratio is often referred to as the "multiple" because it demonstrates how much an investor is willing to pay for one dollar of earnings. Right now, large well-known Technology companies are being priced at valuations below their historical 3-year average (chart below). 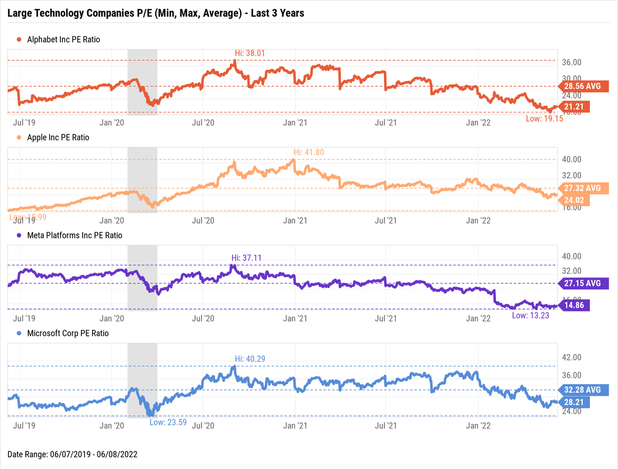 Now let's compare this with four companies below which are classified as "Consumer Staple" companies. These are companies that sell essential products used by consumers. These are typically goods that people are unable or unwilling to cut out of their budgets regardless of their financial situation. This makes these companies non-cyclical in nature. 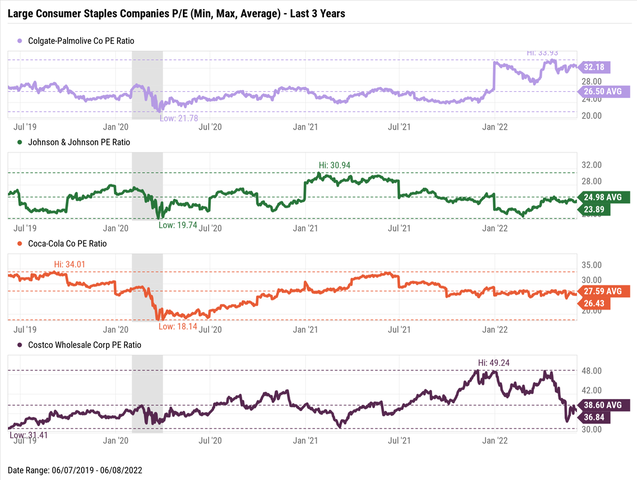 Below is a Scatter Plot of both the Technology and Consumer Staple companies from above. This graph is comparing their current valuation (P/E on the x-axis) vs. 3-year Earnings per Share Growth (Y-axis). As is apparent, the Technology companies have had substantially higher earnings per share growth (Y-axis) while their current valuations (X-axis) is lower. On the Scatter Plot, the upper left corner would be the best quadrant and the lower right would be the worst quadrant. 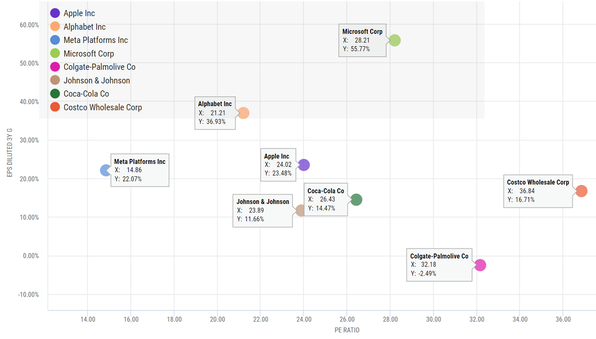 So what are these numbers and charts saying? These 3 charts are conveying the following:
What does all this mean? Collectively the four Technology companies look inexpensive relative to the four "so called" safer Consumer Staple companies. Keep in mind this doesn't mean that these Technology companies can't go lower. All else being equal, it's better to own a company or a collection of companies with higher earnings growth and a lower valuation. -Paul R. Rossi, CFA 
Seven seconds. Seven seconds is the somewhat popular belief of a goldfish’s memory. Apparently after seven seconds the goldfish has completely forgotten what happened prior. Whether this is true or not, let’s go with it for now. I would say in some sense, having a goldfish's memory can be an advantage. However, understand that the media wants you to have a long memory, more akin to the memory of an elephant (assuming you believe that elephants have great memories). They want to fill your head will all the things that went wrong, are currently going wrong, might go wrong, and will go wrong far into the future after we have all passed away (recent news title: the sun will die in approximately 5 billion years and how this will impact us). Why? It keeps us all hooked to what they are going to say next. And that’s how they make money. Never forget that. The financial media would like you to believe that it's important to know what happens every day in the markets. They want you to know when the market is down 3% for the day, down 5% for the week, or down 10% for the month. In this case, be like a goldfish. Give it seven seconds, no more. I don't know anyone that measures their own personal success in days, weeks or even over the course of a year. For example, college typically takes four years or more for an undergraduate degree and a graduate degree can take several more years after that. We all measure the graduate on their success in graduating after years of studying. Professional success is no different. It takes years to become an expert. I’d like to hear of any professional athlete who mastered their sport in a day, week, month, or even a year. How about a surgeon? How many years before they are considered an expert in their field? Physicist, Contractor, Accountant, you name it, no one masters anything measured in anything smaller than years or decades. Investing success is no different, it is measured in years and decades, not in days, weeks, or months. Mastering the markets is more about mastering yourself rather than actually mastering the markets. How do you master yourself? By mastering your emotions and your memory. This is what makes investing so hard. -Paul R. Rossi, CFA |