 If you hold mutual funds, you are losing money that you don’t need to be losing due to the way they are structured. If we designated mutual funds with a number similar to what technology companies call their software versions, mutual funds could be considered “Version 1. 0.” The mutual fund structure is almost 100 year old technology. Some wine connoisseurs make the argument that certain wines get better with age, the same cannot be said about the mutual fund structure. Why haven’t you heard of this before? Because there are billions of dollars in management fees, research expenses, and trading costs that Wall Street would rather you not focus on. Structurally, mutual funds are not efficient. Are you aware that your neighbor down the street who you never talk to can directly affect your taxes? Yep. When you neighbor sells their mutual fund position the mutual fund manager must sell the underlying positions in the mutual fund to raise cash to then send to your neighbor. And since the fund sold the underlying positions to raise cash, if there was a gain, this gain can be passed along to you in the form of a taxable gain even though you didn’t sell your position. If this sounds a bit archaic, that’s because it is. You might ask, there has to be a better way? And you’d be right, there is a better way. It’s called an Exchange Traded Fund or ETF. I would call ETF’s the software equivalent of at least version 2.0. They are structurally completely different than mutual funds, but from an investors perspective they are effectively the same. They can hold a basket of securities (US stocks, foreign stocks, corporate bonds, commodities, US treasuries, etc.) just like mutual funds and allow investors to purchase and diversify very easily. A recently released Goldman Sachs paper reported that in 2019:
By using ETF's instead of mutual funds, investors can better control when they pay taxes, or in other words, pay when they sell their shares rather than when their neighbor (i.e., other shareholders) does. Similar to an iPhone software update, it's time to update your investment software. -Paul R. Rossi, CFA
0 Comments
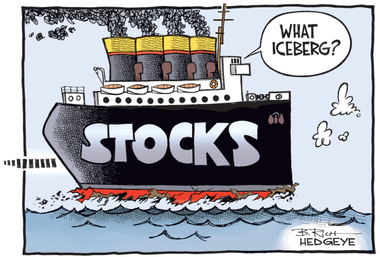 Since the stock market bottomed in 2009 (during the Financial Crisis), the US stock market has enjoyed an unbelievable ride higher with very few major corrections. In fact, from the March 2009 bottom, the market is up over 700%. With such a great, “seat of your pants” type of ride over the last decade, it might make sense to take a step back and assess where we are now. To offer some perspective on the stock market - below are five measures that illustrate where market valuations currently stand: 1. S&P 500 Price to Earnings Ratio (P/E Ratio) The S&P 500 P/E Ratio measures the combined price of all 500 Standard & Poor constituents against their aggregate earnings-per-share. Its latest reading is 25.39, which means investors are paying just over $25 for every dollar of earnings. The P/E ratio has historically been below 20, so this would suggest that the market is currently over-valued. However, when we look at the forecasted P/E, it is currently 21.87 which is more inline with historical averages. In addition to this: Lower interest rates can justify higher valuations, all else being equal - there is an inverse relationship between interest rates and valuations which I will write about in the future. Indicator Conclusion: Mildly Overvalued 2. S&P 500 Cyclically Adjusted P/E Ratio (CAPE Ratio) Similar to the P/E ratio, the CAPE ratio divides the S&P 500’s current price by its 10-year earnings, adjusted for inflation. Why adjust the traditional P/E Ratio? By using a 10-year period, this tends to smooth out year-to-year fluctuations in earnings which can be somewhat volatile over shorter periods of time. The idea is a higher CAPE ratio could reflect lower future returns, whereas a lower figure would indicate higher returns. The CAPE Ratio was developed by Noble prize winner Robert Shiller of Yale back in the 1990’s; however, this idea is not exactly new, Benjamin Graham (the father of value investing) and David Dodd recommended using 7-10 year averages in their seminal 1934 book Security Analysis when using valuation ratios. There is some research that shows over long periods of time this ratio tends to predict future long-term returns fairly well. However, the CAPE ratio isn’t expected to predict what the market might do over short periods of time. Having said that, large spikes in the CAPE ratio have often preceded recessions, and it’s important to realize that the metric is currently approaching its highest level on record. The CAPE ratio currently stands at 38, which is 26% higher than its 5-year average, 40% higher than its 10-year average, and more than double its 100-year average. Indicator Conclusion: Significantly Overvalued 3. The Buffett Indicator In 2001 Warren Buffett said that US Market Capitalization as a percentage of GDP is “probably the best single measure of where valuations stand at any given moment,” The ratio measures the aggregate value of the US stock market relative to the country’s economic output. Where is it now? It is currently at its highest level ever. Investors are paying over $2 for every dollar of US GDP, compared to a long-term average of $0.82. Buffett went on to say, "for me…if the percentage relationship falls to the 70% or 80% area, buying stocks is likely to work very well for you. If the ratio approaches 200%–as it did in 1999 and a part of 2000–you are playing with fire" I’m not one to argue with Buffett’s thoughts, so this isn’t a great sign. Indicator Conclusion: Significantly Overvalued 4. S&P 500 Dividend Yield The dividend yield is the aggregate dividend of all the companies in the S&P 500 divided by the price of the S&P 500. Basically, this is how much the 500 largest US companies are paying investors in terms of dividends. All else being equal, a low or falling dividend yield means high or rising share prices. Currently the S&P 500 dividend yield is at a 20-year low. Over the last 10-years it has hovered between 1.75% - 2.25%, it’s currently at 1.26%. And there are only two ways for this number to increase, either dividends increase, or stock prices drop. I know which one I’d prefer. Indicator Conclusion: Overvalued 5. The Yield Curve Long-term treasury rates are almost always higher than those of shorter-term rates. Why? Because investors expect to be compensated for lending money over longer periods of time due to risk and the time value of money. However, when shorter-term rates are higher than longer-term rates - the opposite of what is “normal”, it signals shaky confidence in the economy, and typically leads investors to shift from riskier assets to safer assets, in essence moving from stocks to bonds. This phenomenon, known as an inverted yield curve, has rather consistently foreshadowed recessions and market downturns. A popular yield curve measure used by the market is the spread between the 10-year treasury vs. the 2-year treasury. Just before the last four recessions, the 10-2 spread went negative and the stock market turned negative shortly thereafter. The good news is currently the yield curve is “normal” with the 10-2 spread sitting right around its historical average. Indicator Conclusion: Normal Is a Market Correction Coming? The short answer is yes. Why? Because corrections happen somewhat regularly. Since the Financial Crisis there have been 4 corrections of 15% or greater, with 1 of these 4 corrections being the Covid correction of over 30%. Not only can corrections occur by prices dropping, but corrections can also come from prices staying flat (for years) despite company growth—rising earnings, sales, book value, among others without price increases (think the 1970’s). Either way, the market has always ebbed and flowed over time, oscillating between overvaluation and corrections, but the long-term trend is positive if you have the time. While I don’t advise dancing in and out of the market based upon headline news. I do think it’s prudent to have some understanding of where we might be in terms of the economic cycle and market valuations. Why is this prudent? This gives you a good reason to take some time to thoroughly review what you own, why you own it, and what the future might realistically hold for your portfolio. Having realistic expectations is fundamental to successful investing. With valuations where they are currently, it would be well-advised to use this to temper your future return expectations. If you have a well-thought out, well-designed portfolio coupled with a rock-solid financial plan then you shouldn’t be overly concerned with market fluctuations. Although, that’s a big “if.” -Paul R. Rossi, CFA  I’m a huge proponent of self-improvement and growth. The idea of making small improvements compounds over time and can become extremely meaningful. Let me give you an example: Most people would agree that typically making a 1% improvement isn’t much of an improvement. And I would agree. On the other end of the spectrum, a 100% or 200% or even 1,000% improvement is quite substantial. However, what if you are able to make many 1% improvements over time, this is where things get quite interesting. Assume you are able to make a 1% improvement everyday for just 1 year. How much do you think you would improve? 50% 100% 365% These would all be great improvements, but the actual answer would be a 3,788% improvement. At the end of a year you would be over 37 times better than you were when you started. All from just a 1% improvement every day. The formula is: (1 + 0.01) ^ 365 This is an example of the power of compound growth. Einstein has been attributed to saying, “compound interest (growth) is the 8th wonder of the world.” And even if he didn’t say it, I’m sure he would agree with this idea. Compound growth is incredibly powerful and is quite possibly under appreciated by most people outside of mathematicians and athletes. One such person who I’m confident understands the power of continuous improvement is Wayne Gretzky. It truly is hard to comprehend just how great Wayne Gretzky was on the ice. He made the All-National Hockey League First-Team 8 times, holds the record for most points all-time, most points in a season, most all-time assists, youngest player to score 50 points, most game winning goals in play-offs, and the list goes on and on. He retired in 1999 and STILL holds 60 records in the NHL. And if you can’t remember all his amazing records, you can just call him by his moniker, “The Great One.” He understood the idea of continuous improvement, hard work, and living a fulfilled life. Here are some of his own words on these subjects.
We all can't be Wayne Gretzky, but we can strive to take his ideas and incorporate them in our lives. -Paul R. Rossi, CFA 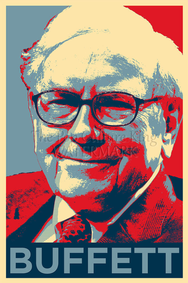 It wasn't easy, but here's a list of some of my favorite Warren Buffett quotes I compiled. What made this so hard? Choosing just 25 made it hard, I could have easily come up with a list of several hundred. How did I come up with this list? I went through several books I have about him and numerous shareholder letter's he's written over the years and used quotes that gave a broad range of invaluable insights to living a happy healthy life. A person would be hard pressed to not do well if they lived by his way of thinking. Some of my thoughts are in italics. So here they are: The 25 Greatest Quotes of Warren Buffett
-Paul R. Rossi, CFA
 It’s easy to get a bit mixed up by the many moving parts and features of Medicare. This article hopes to help you make sense of the alphabet soup which is known as Medicare. Quick note: At the bottom of this article, I've included a 2-page PDF tear sheet that can be downloaded, printed off for future use, or worst case, on those nights you are having difficulty falling asleep, it can be used as a sleeping aid. The information below provides some information on the major coverage options, called parts A, B, C, D, and some of their more significant aspects. Use it to help you think about what level and combination of coverage suits you and your family the best. Medicare Part A (hospital coverage): Part A is the portion of Medicare that pays hospital costs. Part A also includes some benefits for skilled home care, hospice care, and the first 100 days of skilled nursing care. You probably won’t have to pay any premiums for Part A, because you already paid for it with payroll taxes while you were working. In 2021, you have to pay the first $1,484 of the cost of each hospital stay. Part A covers the rest for the first 60 days, and then you pay the first $371 per day for days 61–90. After that, there are “lifetime reserve” days (you have a total of 60 days to use in your lifetime, and then they are done), for which you pay the first $742 per day. You are responsible for the full cost of any additional days. Medicare Part B (medical coverage): Part B is the portion of Medicare that covers outpatient health care visits such as doctors, outpatient surgery, diagnostic testing, durable medical equipment, and ambulance services. Part B is not free. You’ll pay premiums ($148.50 per month in 2021)—and if your income is over a certain amount, your premiums are subject to surcharges. These surcharges are based upon your modified adjusted gross income as reported on your IRS tax return from 2 years ago, which can be as much as $504.90 per month for income above $500,000. Under Part B, you are responsible for the first $203 of covered medical services. Once that deductible is met each year, you will typically owe 20% of the cost of such services, although you may also owe “excess charges” for some providers. Medicare Part C (Medicare Advantage): Part C plans are private plans that contract with Medicare to provide Medicare A and B benefits. Many of these bundled plans are available for only the cost of the standard Part B premium. More than 60% of Medicare Advantage enrollees are in HMO plans, with the vast majority of the rest in PPO plans. Medicare Part D (prescription drug coverage): Part D plans are optional prescription drug plans available to everyone who has Medicare. These private plans contract with Medicare to provide at least a standard level of prescription coverage. They are available both as stand-alone plans and as part of Part C (Medicare Advantage) plans. Premiums vary, and there are surcharges for those with higher incomes, but as of 2021, they ranged from $12.30 to $77.10 per month. *Medicare Supplemental Insurance (Medigap). Medigap policies are private policies designed to cover expenses not covered under Part A or Part B (above). To make things confusing they follow standardized forms, designated with letters A through N. Medigap policies add to the “alphabet soup” confusion. Example: Medicare Part A and Medigap Plan A are not the same thing. Any Medigap policy designated with a particular letter provides a specific set of benefits, regardless of which company issues it. It's important when approaching 65 years of age that you do your research to determine what is best for you and your family. Action Item Generally when you turn 65, this is called your Initial Enrollment Period. It lasts for 7 months, starting 3 months before you turn 65, and ending 3 months after the month you turn 65. If you miss your 7-month Initial Enrollment Period, you may have to wait to sign up and pay a monthly late enrollment penalty for as long as you have Part B coverage. The penalty goes up the longer you wait. You may also have to pay a penalty if you have to pay a Part A premium, also called “Premium-Part A.” Regardless of which Medicare option you choose, you need to do it in a timely manner. Otherwise, you could encounter periods of time when you,
This is something you don't want to miss, put a reminder in your phone. In fact, I would recommend a full 6-months before you turn 65, you start your Medicare research so by the time you are in the 7-month Initial Enrollment Period you can sign up and you'll will know exactly what options you'd like and you'll have a good idea of all the costs. To do your research and for a more complete description of costs, what is and is not covered visit www.medicare.gov - Paul R. Rossi, CFA
|
||||