 "Earth Rising" - NASA Apollo program Just seventy years ago no human being had ever seen the entire Earth in one picture; or more accurately, no one had seen the entire "disk" of the Earth in one picture. The space race during the 1960's between the United States and the former Soviet Union helped propel both countries to achieve many prodigious firsts: the first person in space, the first person to orbit the earth, the first person to spacewalk, and the first men to walk on the Moon. These are some of the most impressive scientific achievements humankind has ever accomplished, and all of this was done in a little over a ten year period (1958-1969). During this time, we captured pictures of the entire Earth for the first time. We were able to see our home from a vantage completely unimaginable by our ancestors. What do you think Christopher Columbus, Ferdinand Magellan, Zheng He, and other explorers would have thought if they were alive to witness this? While we have known for hundreds, if not thousands of years that the earth was spherical, we had never actually seen the Earth from a perspective from far enough away to see it in its entirety. Want to change your thoughts? Try changing your perspective. Most would agree that pushing forward and leaning into our lives is a great way to accomplish many of our goals and living our lives on purpose. While I completely agree with this, I would add, that it can be equally beneficial to step back from time to time to gain a different perspective on where you are, where you want to be, and how to get there. In at least one way, successful investing is similar, having the proper perspective can change quite a few things. It can change how you view investing, how you view current events, and even how you view yourself. In the simplest terms, the market takes two step forward and one step back on a regular basis. Although the 2 to 1 ratio varies, sometimes it's 1 step forward and 2 steps back in the short run. But it's the long run where wealth is created. Let's look take a look at a 1-year, 10-year, and 90-year chart. The three charts below are called "Percent Off High" charts, which means it only shows the drawdowns in the market. Every time the graph is at the top of the chart it's making a new high, when it come down it's showing a drop from a recent high. Over the last year (see 1-year chart below), the Dow Jones Industrial Average has been down multiple times. 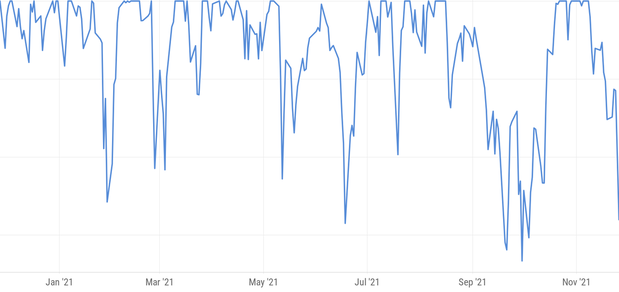 If we look back over the last 10-years (chart below), it's difficult to count how many times the market has bounced around. Being down from a recent high is quite normal. In fact, most of the time the stock market is in a drawdown. 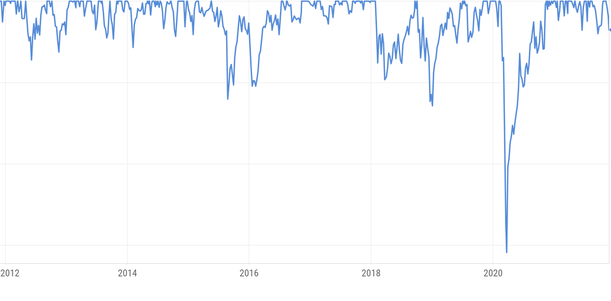 Stepping back even further, from 1930 to today its hard to even see our current drawdown on the far right hand side of the chart. However, what does stand out is the Great Depression and several other recessions (grey columns). 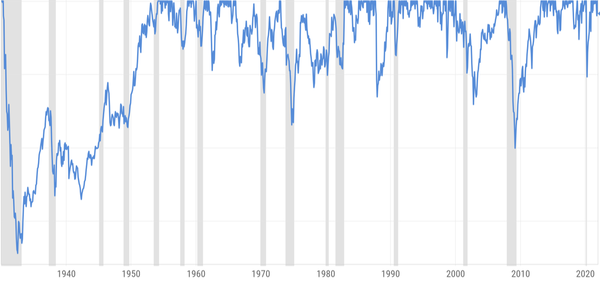 So what do these three charts reveal to us? They tell us it's very common to have periods where the market is down. In fact, most of the time the market isn't at an all-time high, but rather in some type of drawdown. They also tell us the stock market (and many other markets for that matter) exhibit a fair amount of cyclicality, somewhat analogous to the regularity of the moon's orbit around the Earth. So the next time you are feeling uneasy about the stock market, your retirement portfolio, or just about anything else, take a step back. Take a big step back, and try to see the situation from a different perspective to decide if what you are experiencing is consistent with historical patterns. From this new vantage point you can determine the best course of action. -Paul R. Rossi, CFA
0 Comments
 Most people are familiar with the definition of Arachnophobia: the fear of spiders. It’s the most common phobia. Followed by Ophidiophobia: the fear of snakes, Acrophobia: the fear of heights, and Aerophobia: the fear of flying. In fact, if you search for phobias, there are literally hundreds of listed phobias from which people suffer. Below are a few I found that you might not have heard of before.
What exactly is a phobia? A phobia is known as an irrational or extreme fear of something. The something can be caused from a particular situation, a certain place, an object, or an animal. What happens to people who suffer from a phobia? A person can experience a long list of symptoms, some of which include: a rapid heart rate, nausea, sweating, crying, and dizziness. These physical manifestations can even be experienced by just the thought of their phobia. I empathize with people suffering from debilitating heath issues, including those struggling with phobias. And I would hope they would seek out professional medical treatment if possible. For people who do not suffer from a phobia, hearing about someone fearful of gravity or the fear of the figure 8 seems can seem completely irrational. To the person who suffers from the particular phobia, the sense of fear is real, so real in fact, that they experience a physical response. As a financial professional, I appreciate how even people who do not suffer from a phobia can still be conditioned to be fearful of all sorts of things the financial media anoints as the current 600lbs monster in the room (see the picture above). We have 24-hour news channels filling us with all sorts of anxiety laced financial news; we carry little devices in our pockets that continually provide updates with everything that is going wrong, could go wrong, or in an alternate universe, did go wrong. All of this needlessly feeds our fears. And most of the time our fears are misguided, caused by the incessant outside noise we all experience every day. What can we do to combat this onslaught we endure? While, I won’t ever claim to be a medical expert, there are some basic steps you might try to claim a bit of calmness and balance.
Remember, the media will ALWAYS find something you should be worrying about. Right now, the two big media stories are:
What do you think the media will focus on in 2022, 2023, or even 2030? Why do I ask this? Because the misgiving media will never run out of scary things to push on us. Almost one hundred years ago, FDR said, “The only thing we have to fear, is fear itself.” And he was right. -Paul R. Rossi, CFA  The story is told of a Seeker of Knowledge who sets off in search of the answer to a question that has unsettled him for quite some time. In his extensive travels, the Seeker of Knowledge hears of two wise men who are said by many to be very knowledgeable and experienced in such matters. The first, a famous guru lives in an ivory tower at the top of a serene mountain high above all the hustle and bustle of everyday life. After a strenuous climb, the seeker reaches the top of the mountain, finds the sage inside his tower and poses his burning question, “What is a stock worth?” The guru answers immediately, “The value of a stock is the sum of all the projected future cash flows in perpetuity, discounted back at an appropriate discount rate which factors in the risk premium and interest rates." The guru says, "It is quite easy to prove that the stock value = CF/(1+rp + i)^1 + CF/(1+rp + i)^2 + CFn(1+rp + i)^n …” The Seeker of Knowledge is impressed with this answer, as it seems pretty exact, albeit a bit complicated. The seeker is extremely grateful for this valuable information, warmly thanks the Wiseman, and goes on his way. The second Wiseman lives in the middle of a bustling city surrounded by a constant swirl of activity and noise. The seeker is fortunate to get in front of this second guru and is able to pose the same question he asked of the first guru, “What is a stock worth?” Like the first guru, the answer is immediate, “That depends. Are you buying or selling?” Not knowing quite what to say the seeker starts to respond by repeating the words and equation of the first guru but he is quickly interrupted with, “I don't care about all that stuff, tell him to make me a bid then we can talk about what the stock is really worth.” A bit confused and not at all sure the wise men's answers have brought him any closer to enlightenment the seeker goes away to contemplate further on this question. This parable offers two very different answers to the same basic question. The distinction between them reflects the not often recognized difference between valuation theory and actual stock prices. The Discounted Cash Flow Valuation Model above and others like it, are theories that try to derive the value of a stock so that is it is mathematically consistent with the inputs. These valuation models are forced to make many assumptions. In this case, assumptions such as:
Accurately coming up with these three inputs alone is a herculean feat and shouldn’t be underappreciated. There is quite a lot of value in thinking about stock valuation and pricing as a range of rational possibilities, because the process is a blending of part science and part art. -Paul R. Rossi, CFA You might ask, what does a picture of a blackhole have to do with the article? Absolutely nothing, I just like the picture. :) The parable above has been modified from a 1989 Financial Analysts article Journal written by Professor Stephen Figlewski of NYU. The original article pertained to Option Valuation and Pricing.  In physics, there is a well-known problem that is quite difficult, if not impossible. It’s called the three-body problem and is one of the most complicated in celestial mechanics. It’s the process of exactly solving for the motions of three bodies interacting through the inverse square force (gravity) – think of how the Sun, Earth, and Moon interact with each other. For centuries, physicists and mathematicians knew this problem is not integrable, i.e., we cannot find a precise analytical solution. What might be surprising though, physicists have solved the two-body problem. But by adding just one more body into the mix, the solution becomes impossible. Even though the three-body problem hasn’t been solved, how have we able to calculate the motion of all the planets in our solar system with such accuracy? Physicists reduce the three-body problem to something they can calculate, a more manageable two-body system. For example, although there are more than three bodies in the solar system (the Sun, eight planets, dozens of moons, and millions of asteroids and comets), almost everything behaves, roughly, as though it were a two-body system. Why? This is due to the substantial differences in mass between all the objects in our solar system. As far as each planet is concerned, the Sun is the primary influence due to its the sheer size. The Sun ‘pulls’ on the Earth about 200 times harder than the Moon, and about 20,000 times harder than Jupiter. So, if you want to calculate the orbits of all the planets, a “two-body approximation” will get you more than 99% of the way to the right answer. So what have we learned so far?
Using the idea physicists use to solve the three-body problem and what we have learned so far, I’d like to propose a similar thought about valuing high-growth companies. It’s a difficult process and a precise solution isn’t possible, but we should think of a solution being a range of possible valuations as there are many interactions (bodies) that affect valuation. The formula for a dividend paying company is fairly straight forward and therefore we can think of a dividend-paying company as a two-body problem which we can value much more reliably than non-dividend-paying companies. Unfortunately, many growth companies don’t pay dividends. Having said that, we can still get an “approximate” answer to our growth company problem, we just have to keep in mind that the solution should be a range of valuation possibilities rather than one precise "exact" answer. So let’s do it. To help determine if a company’s stock might be under-priced, fairly-priced, or over-priced, we can use some basic ideas of finance. One of these ideas is comparing a company to the overall market. Let’s use an example to drive home how this works: We want to figure out if AMZN (Amazon) is potentially under-valued, fairly-valued, or over-valued. Using recent financial information, we see that AMZN’s PE ratio is 64. (PE = Price per Share / Earnings per Share). Essentially, how much are investors paying for every $1 dollar of earnings. In this case, new investors are paying $64 for every $1 of AMZN earnings. AMZN’s PE ratio of 64 is substantially higher than the current market PE of 25. It’s a staggering 256% higher. What does this mean? This means that new buyers of AMZN are paying 256% more for every dollar of earnings than the average company within the S&P 500. The next question should be, why is AMZN trading at a price so much higher than the market and is this justified? Let’s find out. Some Assumptions: AMZN PE = 64 Stock Market PE = 25 Growth Rate of AMZN = 20% Growth Rate of Stock Market = 7% Dividend Yield of AMZN = 0% Dividend Yield of Stock Market = 2% T = Time in Years of Required AMZN growth to justify current valuation The formula is below (#1), and (#2 - 7) is the calculation:
So based upon these calculations we find that AMZN would need to grow at 20% a year for the next 9.95 years and then grow at the lower overall market growth rate in perpetuity to justify its current PE ratio of 64. So the question becomes, do you think Amazon can continue to grow at 20% a year for the next 10 years? If so, then its current valuation seems appropriate. If you think Amazon will grow faster than 20% or for longer than 10 years, it could be considered undervalued. Conversely, if growth doesn’t materialize or is substantially shorter than 10 years, then the current valuation isn’t justified. Like the dreaded three-body physics problem, valuing growth companies isn't easy, but it can be done with approximation. -Paul R. Rossi, CFA
|
||