Following a budget is essential to financial health, but it can challenging for many people to create one and stick to it. Learn how to prioritize your spending when creating a budget and how to adapt expert advice to your financial goals. WHY BUDGET? Whether you’re working towards business, fitness, or financial goals, what matters most is creating a well-designed plan to get you from where you are today to where you want to be in the future. When it comes to meeting financial goals, a budget is one of the first building blocks of a sound financial plan. A budget shows how much income you’re bringing in and how much you plan to spend on different expenses. While you might not have much control over the inflow—household income—you can control the cash flowing out. Create a budget by:
Action step: Make adjustments to spending based upon on the 3 steps above. Ultimately, this will help you make financial decisions today that will help you meet tomorrow’s financial goals. WHAT MATTERS MOST When prioritizing spending goals, many families work towards building savings and investing while paying off debt.
A good financial advisor can help you to prioritize these goals based on your current financial situation, age, and other factors to help allocate the right amount to what's most important to you. Wondering where to find the money to build savings and pay off debt? Begin by tracking your spending. FOLLOW THE MONEY Once you are ready to create a budget, begin by determining how much after-tax money flows in and out of your household. This gives you an overview of how well you are meeting your fixed and variable expenses, and how much money you could earmark for your goals (above). While recording your after-tax income from earnings, investments, or other income is simple, recording your cash outflows is many times more complicated. You might have the best intentions to stick to a budget, but where does your money ACTUALLY go? For at least month week, track your spending using either a spending tracker app or old-fashioned paper and pencil. Identify the spending categories for every dollar flowing out of your accounts. This will show you when and where your spending occurs. Are there any surprises? Where could you cut back on expenses? Identify areas where you overspent, as well as opportunities to cut costs. WHAT A WELL-DESIGNED PLAN CAN PROVIDE Building a personalized household budget, prioritizing your spending categories, and crafting an actionable financial plan to help you meet your goals can:
Here's to getting ready for the New Year and a new way of thinking about your budget. It's much more than just numbers. -Paul R. Rossi, CFA
0 Comments
 Sometimes I feel the fear of uncertainty stinging clear And I, I can't help but ask myself How much I let the fear take the wheel and steer It's driven me before And it seems to have a vague, haunting mass appeal But lately I'm Beginning to find that I should be the one behind the wheel Whatever tomorrow brings I'll be there With open arms and open eyes, yeah Whatever tomorrow brings I'll be there I'll be there So if I decide to waiver my chance To be one of the hive Will I choose water over wine And hold my own and drive? Oh It's driven me before And it seems to be the way, that everyone else gets around But lately I'm Beginning to find that when I drive myself, my light is found Whatever tomorrow brings I'll be there With open arms and open eyes, yeah Whatever tomorrow brings I'll be there I'll be there Would you choose water over wine? Hold the wheel and drive Whatever tomorrow brings I'll be there With open arms and open eyes, yeah Whatever tomorrow brings I'll be there I'll be there Lyrics and song by: Incubus Lead singer: Brandon Boyd explains, “The lyric is basically about FEAR, about being driven all your life by it and making decisions from fear. It’s about imagining what life would be like if you didn’t live it that way.” Not being ruled by Fear. I get it. It can be easier said than done. Because we are constantly being bombarded. 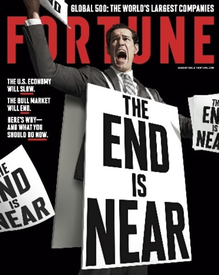 Market up 68% and GDP up over 3 trillion from when this magazine was issued in 2018 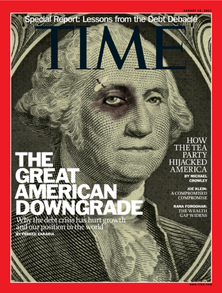 Market up over 265%, GDP up over 8 trillion from 2011. 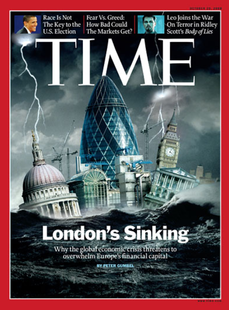 The fear mongering isn't isolated to just the U.S. 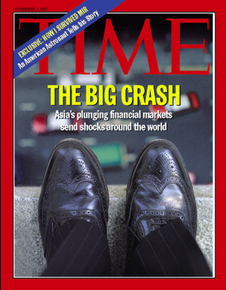  Just to make sure they don't miss any region or country; they'll just name the whole world. We should all be living in a state of constant fear. Brandon Boyd of the band Incubus incapsulated it so well when he said, "It’s about imagining what life would be like if you didn’t live it that way.” Let's not only imagine it, let's live it. -Paul R. Rossi, CFA Click below to listen to the song bit.ly/IncubusDrive My martial arts instructor, Ken, recently passed away at the age of 60, less than 4 months after he was diagnosed with cancer. In his honor, I’d like to highlight some of what I learned from him over the 20+ years I received lessons from him. I received amazing martial arts lessons from Ken over all those years, ironically a lot of what I learned from Ken is applicable to living a more fulfilling life, and it is this aspect that I will primarily shine a light on. First a little background. Back in January 1994 I started training in a Chinese street fighting system, and from the time I signed up, I dove deep into training, consistently working out 3 to 4 hours a day, 4 to 5 days week. Time was spent learning the hundreds of techniques, hand weapons, blocks, kicks, and sparring drills that were required to be mastered. This time included both group and private lessons from various instructors. In 1997, my head instructor at the time, began getting lessons from a higher-ranking black belt named Ken, and my instructor would come back and talk about these amazing lessons he would get from this incredible martial artist. Being that I wasn’t a black belt yet, I wasn’t in a position to ask about getting private lessons from Ken. However, over the course of the next couple of years, Ken would periodically come into our school and give group lessons. Ken was a high-ranking black belt within our system of schools which were located throughout California. However, he ran his own school within the system about an hour and a half away, so it was very infrequent that he taught at our school as he had his own school to run. Although, anytime we heard that Ken might be coming into our school, students would make every effort to attend his class, as we all knew we would experience something special. We were never disappointed. After 6 years and 4 months of intense training, I earned my black belt on April 17th of 1999. It’s a date I’ll never forget. Shortly after I earned my blackbelt, the martial arts school that I was a part of was going through a transition and going in a direction I didn’t particularly agree with. With how I was feeling, and now that I was a blackbelt, I felt somewhat confident that I could reach out to Ken directly and ask him if I might get a lesson or two from him. Interestingly enough, I found out he felt the same way about the system and was leaving the martial system that he had been a part of since the early 1980’s. At the time, he was the second highest ranking black belt in the entire system and by far the most accomplished. He thought differently, he trained differently, he moved differently, and taught differently. What I did know, was that I would do whatever it took to get lessons from him. What I found surprising is that other people could have approached him as well, but never did. I don't know what stopped others from reaching out to Ken, but I knew I would figure out a way to learn from him. When I approached Ken about getting lesson, I didn’t really know him. Yes, he had given group lessons that I was a part of over the years, but outside of that, I wasn’t sure if he even knew who I was. However, I did know that I wanted to move like him and that no one else had his level of mastery. An analogy that might make this clearer between Ken and all the other instructors would be like seeing a painting by Michelangelo or another world-class artist, and then seeing a drawing done by a young child. There simply was no comparison. I recognized this vast difference rather quickly and if there was any possible way, I only wanted to learn from the best. How could any aspiring artist not want to learn from Michelangelo if he there was any possible way? What I found interesting was that very few people reached out to Ken, it seemed they would rather stay in their comfort zone. What I came to realize from Ken, is that a lot of people would rather feel good about themselves than to confront their inadequacies. Ken liked placing a figurative and literal mirror in front of his students to expose their deficiencies. He would say, it’s only then that a person can learn and truly grow. They need to know what they are doing wrong, before they can begin to change, and eventually do it right. Ken was incredibly critical. He strove for perfection in himself and his students. Most students couldn’t handle this level of scrutiny, they wanted the easier road. Most just wanted to earn their next belt. I wanted to get better, I wanted to learn, and I wanted to master the real-world applications. Rank wasn’t important to me and still isn't. For example, one particular private lesson he was teaching me from a wheelchair, as he had broken both of his feet training (again, another story for another time). He spent almost two hours trying to get me to step the correct way. Without getting into too much detail, I had to step forward with my left foot and then step forward my right foot. Seems straight forward enough. Step with my left foot, then step with my right foot. Well, it wasn’t, and it still rather difficult to execute this particular technique. Two hours of him stopping me, correcting me, and having me repeat my stepping motion. Imagine for a minute, stepping for two hours and getting stopped just after you’ve started stepping, hearing that you’re not doing it right. He would say, do more of this, or do less of that, do it quicker, do it with less gap between the steps, push off the ground more, etc. No detail was too small. What I learned, besides how to step properly, was this is exactly how he got so good, he worked at something until it was perfect, not almost perfect. Perfect. Then he continued to work at it, so he never lost “it.” Once he knew it was right, he made sure he never lost how to execute it ever again. Every lesson I ever received from Ken was similar, his extreme attention to detail and willingness to spend any amount of time to make sure I did it right before we moved on. We’ve all heard the adage, “Practice makes perfect.” He said that statement and thinking is absolutely incorrect. He would say, “Perfect practice makes perfect.” And it’s obvious once you hear it. If you practice anything incorrectly, you are not going to achieve a high level of competence. In fact, you are drilling in bad habits which then takes even longer to override the wrong habits and motion. To gain perfection, it requires constant diligence and practicing to perfection. I learned good marital artists practice until they get it right, great martial artists practice until they never get it wrong. Perfect motion with lightning-fast reaction is what he taught and what he expected every time. He expected this level of perfection in everything he did and everything his students did. He believed to a large degree that his students were a reflection of him. So you better not disappoint. And I never wanted to disappoint. Over the hundreds of private lessons I received from Ken over the 20+ years I always walked away amazed and in awe of what he knew, how he could execute a kick, a block, or technique, and his ability to teach at the highest level. Very few people reach the top of their field, very few can teach at the highest level, even fewer can do both. He did both. What was a typical lesson like? We lived about an hour and a half from each other, so I would drive down to his place, and on most days I would find him dripping of sweat already. He was always prepared and expected the same of me. Sometimes he would ask if I had any questions from my previous lesson or anything else I had a question about. If I did have a question, he would explain and show me how to do it. He would explain why he was doing this or doing that and what details were important to remember. He made sure I understood, and then he’d have me do it, to make sure I understood and to impart the proper “feeling” I should have when moving in a particular way. One question typically led to us working on a particular motion or theme for quite some time, many times it took 2-3 hours to make sure I had the proper “feeling” and ensure my question was answered. Other days, he had something he wanted to “show me.” Something he felt I needed to learn, or I might be missing in my proverbial toolbelt. He never held anything back with me, he taught at the highest level, expecting I should be able to do it just as good as he could. He was a proponent of copying or what he called "mimicking." When he would execute a particular move, he would do it slowly so I could follow along and copy his movements and motion. He wanted me to copy him exactly, from the positioning of my feet, hips, shoulders, elbow, hand placement, etc. It might feel awkward or foreign at first, but then over time by mimicking him precisely, his motion would become my motion. Eventually, that is exactly what happened, his motion that I copied, would become mine, and I didn't know how to move any way but the correct way. It was the best way to transfer information. If I copied him (which I did), then any other way to do it was wrong and was very obvious. Over time, this led me to be able to teach myself, because his motion became my motion, and incorrect motion became easy to determine. He would tell me every time he is giving me a lesson, he is also giving himself a lesson. He was constantly in a feedback loop with himself, always striving for improvement, seeking out slight imperfections that he could correct in himself. It made him better; it made me better. My lessons from Ken were mentally and physically exhausting, as I was always trying to take in a firehose amount of information that came flooding out of him. Then after our workout, we would go to a local restaurant he liked. While the physical part of the lesson might be over, he continued to teach. Our lunches always lasted several hours. In fact, I can remember on more than one occasion we ate our lunch and talked so long that we ended up ordering dinner at the same restaurant. It wasn’t uncommon when walking out to the parking lot to leave, he would end up showing me something else we were discussing inside the restaurant. More than once after we had left the restaurant parking lot, I would get a phone call from Ken on my way home so he could continue his thoughts on what we were discussing. It wasn’t unusual for me to show up at his place in the morning and get home almost 12 hours later. Below is just some of what I learned from Ken.
My instructor Ken was far and away the best martial artist I’ve ever seen and feel extremely fortunate to have gotten private lessons from him for over 20 years. Initially I thought he was head and shoulders above the rest, what I came to realize, he was even better than that. He didn’t teach many people privately…I was one of the lucky ones. Thank you Ken. -Paul R. Rossi, CFA  "Earth Rising" - NASA Apollo program Just seventy years ago no human being had ever seen the entire Earth in one picture; or more accurately, no one had seen the entire "disk" of the Earth in one picture. The space race during the 1960's between the United States and the former Soviet Union helped propel both countries to achieve many prodigious firsts: the first person in space, the first person to orbit the earth, the first person to spacewalk, and the first men to walk on the Moon. These are some of the most impressive scientific achievements humankind has ever accomplished, and all of this was done in a little over a ten year period (1958-1969). During this time, we captured pictures of the entire Earth for the first time. We were able to see our home from a vantage completely unimaginable by our ancestors. What do you think Christopher Columbus, Ferdinand Magellan, Zheng He, and other explorers would have thought if they were alive to witness this? While we have known for hundreds, if not thousands of years that the earth was spherical, we had never actually seen the Earth from a perspective from far enough away to see it in its entirety. Want to change your thoughts? Try changing your perspective. Most would agree that pushing forward and leaning into our lives is a great way to accomplish many of our goals and living our lives on purpose. While I completely agree with this, I would add, that it can be equally beneficial to step back from time to time to gain a different perspective on where you are, where you want to be, and how to get there. In at least one way, successful investing is similar, having the proper perspective can change quite a few things. It can change how you view investing, how you view current events, and even how you view yourself. In the simplest terms, the market takes two step forward and one step back on a regular basis. Although the 2 to 1 ratio varies, sometimes it's 1 step forward and 2 steps back in the short run. But it's the long run where wealth is created. Let's look take a look at a 1-year, 10-year, and 90-year chart. The three charts below are called "Percent Off High" charts, which means it only shows the drawdowns in the market. Every time the graph is at the top of the chart it's making a new high, when it come down it's showing a drop from a recent high. Over the last year (see 1-year chart below), the Dow Jones Industrial Average has been down multiple times. 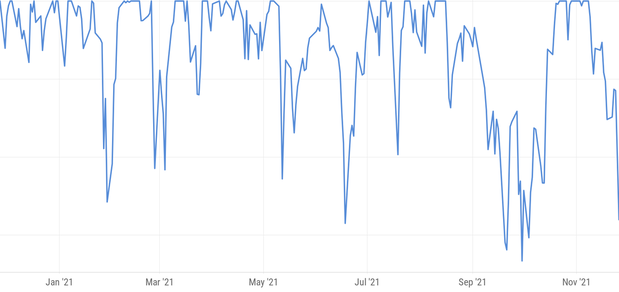 If we look back over the last 10-years (chart below), it's difficult to count how many times the market has bounced around. Being down from a recent high is quite normal. In fact, most of the time the stock market is in a drawdown. 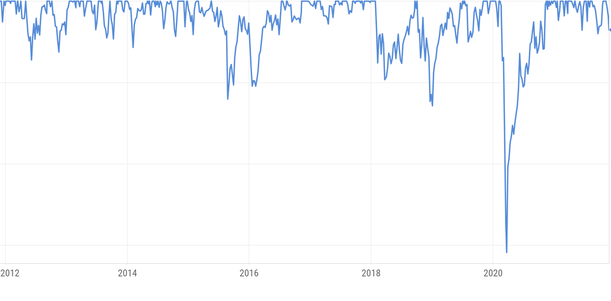 Stepping back even further, from 1930 to today its hard to even see our current drawdown on the far right hand side of the chart. However, what does stand out is the Great Depression and several other recessions (grey columns). 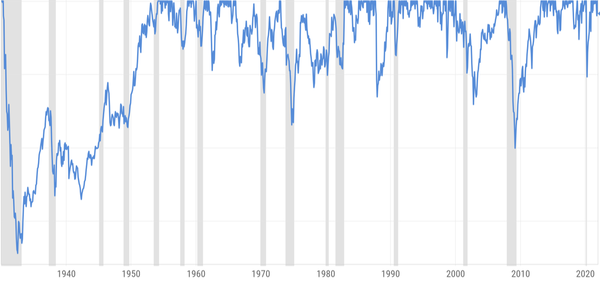 So what do these three charts reveal to us? They tell us it's very common to have periods where the market is down. In fact, most of the time the market isn't at an all-time high, but rather in some type of drawdown. They also tell us the stock market (and many other markets for that matter) exhibit a fair amount of cyclicality, somewhat analogous to the regularity of the moon's orbit around the Earth. So the next time you are feeling uneasy about the stock market, your retirement portfolio, or just about anything else, take a step back. Take a big step back, and try to see the situation from a different perspective to decide if what you are experiencing is consistent with historical patterns. From this new vantage point you can determine the best course of action. -Paul R. Rossi, CFA  Most people are familiar with the definition of Arachnophobia: the fear of spiders. It’s the most common phobia. Followed by Ophidiophobia: the fear of snakes, Acrophobia: the fear of heights, and Aerophobia: the fear of flying. In fact, if you search for phobias, there are literally hundreds of listed phobias from which people suffer. Below are a few I found that you might not have heard of before.
What exactly is a phobia? A phobia is known as an irrational or extreme fear of something. The something can be caused from a particular situation, a certain place, an object, or an animal. What happens to people who suffer from a phobia? A person can experience a long list of symptoms, some of which include: a rapid heart rate, nausea, sweating, crying, and dizziness. These physical manifestations can even be experienced by just the thought of their phobia. I empathize with people suffering from debilitating heath issues, including those struggling with phobias. And I would hope they would seek out professional medical treatment if possible. For people who do not suffer from a phobia, hearing about someone fearful of gravity or the fear of the figure 8 seems can seem completely irrational. To the person who suffers from the particular phobia, the sense of fear is real, so real in fact, that they experience a physical response. As a financial professional, I appreciate how even people who do not suffer from a phobia can still be conditioned to be fearful of all sorts of things the financial media anoints as the current 600lbs monster in the room (see the picture above). We have 24-hour news channels filling us with all sorts of anxiety laced financial news; we carry little devices in our pockets that continually provide updates with everything that is going wrong, could go wrong, or in an alternate universe, did go wrong. All of this needlessly feeds our fears. And most of the time our fears are misguided, caused by the incessant outside noise we all experience every day. What can we do to combat this onslaught we endure? While, I won’t ever claim to be a medical expert, there are some basic steps you might try to claim a bit of calmness and balance.
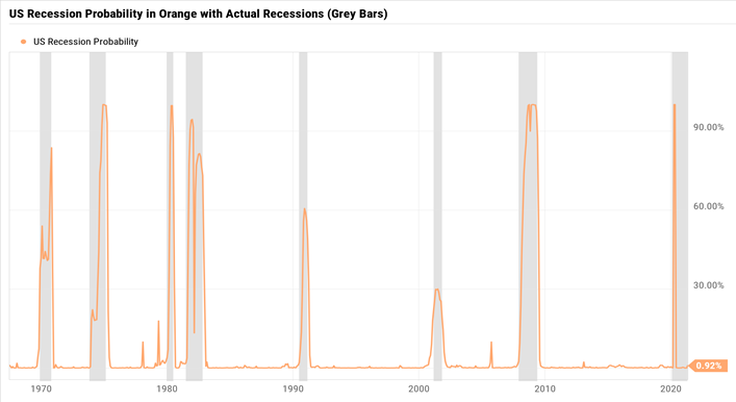
Remember, the media will ALWAYS find something you should be worrying about. Right now, the two big media stories are:
What do you think the media will focus on in 2022, 2023, or even 2030? Why do I ask this? Because the misgiving media will never run out of scary things to push on us. Almost one hundred years ago, FDR said, “The only thing we have to fear, is fear itself.” And he was right. -Paul R. Rossi, CFA  The story is told of a Seeker of Knowledge who sets off in search of the answer to a question that has unsettled him for quite some time. In his extensive travels, the Seeker of Knowledge hears of two wise men who are said by many to be very knowledgeable and experienced in such matters. The first, a famous guru lives in an ivory tower at the top of a serene mountain high above all the hustle and bustle of everyday life. After a strenuous climb, the seeker reaches the top of the mountain, finds the sage inside his tower and poses his burning question, “What is a stock worth?” The guru answers immediately, “The value of a stock is the sum of all the projected future cash flows in perpetuity, discounted back at an appropriate discount rate which factors in the risk premium and interest rates." The guru says, "It is quite easy to prove that the stock value = CF/(1+rp + i)^1 + CF/(1+rp + i)^2 + CFn(1+rp + i)^n …” The Seeker of Knowledge is impressed with this answer, as it seems pretty exact, albeit a bit complicated. The seeker is extremely grateful for this valuable information, warmly thanks the Wiseman, and goes on his way. The second Wiseman lives in the middle of a bustling city surrounded by a constant swirl of activity and noise. The seeker is fortunate to get in front of this second guru and is able to pose the same question he asked of the first guru, “What is a stock worth?” Like the first guru, the answer is immediate, “That depends. Are you buying or selling?” Not knowing quite what to say the seeker starts to respond by repeating the words and equation of the first guru but he is quickly interrupted with, “I don't care about all that stuff, tell him to make me a bid then we can talk about what the stock is really worth.” A bit confused and not at all sure the wise men's answers have brought him any closer to enlightenment the seeker goes away to contemplate further on this question. This parable offers two very different answers to the same basic question. The distinction between them reflects the not often recognized difference between valuation theory and actual stock prices. The Discounted Cash Flow Valuation Model above and others like it, are theories that try to derive the value of a stock so that is it is mathematically consistent with the inputs. These valuation models are forced to make many assumptions. In this case, assumptions such as:
Accurately coming up with these three inputs alone is a herculean feat and shouldn’t be underappreciated. There is quite a lot of value in thinking about stock valuation and pricing as a range of rational possibilities, because the process is a blending of part science and part art. -Paul R. Rossi, CFA You might ask, what does a picture of a blackhole have to do with the article? Absolutely nothing, I just like the picture. :) The parable above has been modified from a 1989 Financial Analysts article Journal written by Professor Stephen Figlewski of NYU. The original article pertained to Option Valuation and Pricing.  In physics, there is a well-known problem that is quite difficult, if not impossible. It’s called the three-body problem and is one of the most complicated in celestial mechanics. It’s the process of exactly solving for the motions of three bodies interacting through the inverse square force (gravity) – think of how the Sun, Earth, and Moon interact with each other. For centuries, physicists and mathematicians knew this problem is not integrable, i.e., we cannot find a precise analytical solution. What might be surprising though, physicists have solved the two-body problem. But by adding just one more body into the mix, the solution becomes impossible. Even though the three-body problem hasn’t been solved, how have we able to calculate the motion of all the planets in our solar system with such accuracy? Physicists reduce the three-body problem to something they can calculate, a more manageable two-body system. For example, although there are more than three bodies in the solar system (the Sun, eight planets, dozens of moons, and millions of asteroids and comets), almost everything behaves, roughly, as though it were a two-body system. Why? This is due to the substantial differences in mass between all the objects in our solar system. As far as each planet is concerned, the Sun is the primary influence due to its the sheer size. The Sun ‘pulls’ on the Earth about 200 times harder than the Moon, and about 20,000 times harder than Jupiter. So, if you want to calculate the orbits of all the planets, a “two-body approximation” will get you more than 99% of the way to the right answer. So what have we learned so far?
Using the idea physicists use to solve the three-body problem and what we have learned so far, I’d like to propose a similar thought about valuing high-growth companies. It’s a difficult process and a precise solution isn’t possible, but we should think of a solution being a range of possible valuations as there are many interactions (bodies) that affect valuation. The formula for a dividend paying company is fairly straight forward and therefore we can think of a dividend-paying company as a two-body problem which we can value much more reliably than non-dividend-paying companies. Unfortunately, many growth companies don’t pay dividends. Having said that, we can still get an “approximate” answer to our growth company problem, we just have to keep in mind that the solution should be a range of valuation possibilities rather than one precise "exact" answer. So let’s do it. To help determine if a company’s stock might be under-priced, fairly-priced, or over-priced, we can use some basic ideas of finance. One of these ideas is comparing a company to the overall market. Let’s use an example to drive home how this works: We want to figure out if AMZN (Amazon) is potentially under-valued, fairly-valued, or over-valued. Using recent financial information, we see that AMZN’s PE ratio is 64. (PE = Price per Share / Earnings per Share). Essentially, how much are investors paying for every $1 dollar of earnings. In this case, new investors are paying $64 for every $1 of AMZN earnings. AMZN’s PE ratio of 64 is substantially higher than the current market PE of 25. It’s a staggering 256% higher. What does this mean? This means that new buyers of AMZN are paying 256% more for every dollar of earnings than the average company within the S&P 500. The next question should be, why is AMZN trading at a price so much higher than the market and is this justified? Let’s find out. Some Assumptions: AMZN PE = 64 Stock Market PE = 25 Growth Rate of AMZN = 20% Growth Rate of Stock Market = 7% Dividend Yield of AMZN = 0% Dividend Yield of Stock Market = 2% T = Time in Years of Required AMZN growth to justify current valuation The formula is below (#1), and (#2 - 7) is the calculation:
So based upon these calculations we find that AMZN would need to grow at 20% a year for the next 9.95 years and then grow at the lower overall market growth rate in perpetuity to justify its current PE ratio of 64. So the question becomes, do you think Amazon can continue to grow at 20% a year for the next 10 years? If so, then its current valuation seems appropriate. If you think Amazon will grow faster than 20% or for longer than 10 years, it could be considered undervalued. Conversely, if growth doesn’t materialize or is substantially shorter than 10 years, then the current valuation isn’t justified. Like the dreaded three-body physics problem, valuing growth companies isn't easy, but it can be done with approximation. -Paul R. Rossi, CFA
 Who is Charlie Munger? By many accounts he is a big reason why Warren Buffett has been so successful. Charlie Munger is Warren Buffett’s partner at Berkshire Hathaway. Ironically, he grew up right down the road from Warren Buffett in Omaha Nebraska, although they didn’t know each other growing up. Charlie graduated from Harvard Law School and started his career as an attorney, however, he realized early on that it wasn’t a profession he wanted to continue with, so he started investing and developing real estate which eventually led him to meeting his future business partner. Together, what Charlie and Warren have built over their extraordinary 60 plus years together could be considered similar to what Mick and Keith or Paul and John where able to do; these extraordinary partnerships were able to capture lightning in a bottle. Howard Buffett, Warren's eldest son, has said that his father is the second smartest man he knows. He says Charles Munger is the first. Like Warren Buffett, Charlie's thoughts on business and life are timeless nuggets of wisdom. Here are some of my favorite Charlie Munger quotes
With Charlie's thoughts above, I hope I've helped you know more. -Paul R. Rossi, CFA 
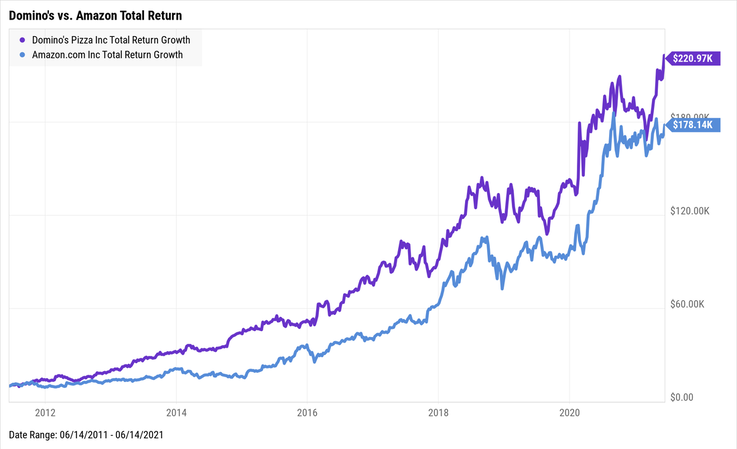
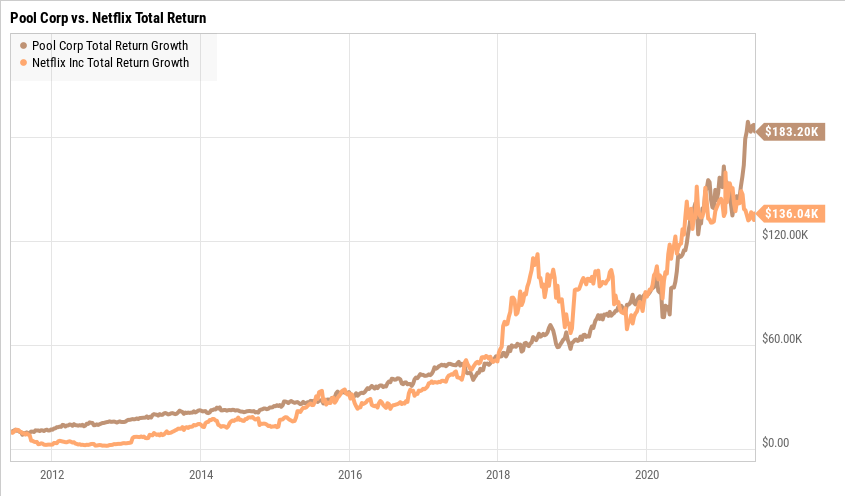
A downturn could actually be good news for you – if you stay calm, stick to a well-designed plan and possibly take decisive action. It’s not uncommon for people to feel a nervous when they hear news about the stock market being down. This nervousness can be exacerbated when someone in the media forecasts a doomsday type of future for the stock market. It’s happened so many times I honestly cannot remember them all. Don't just don't sell just because others are selling, if you sell your stocks after they drop in value you may end up in worse shape than if you stayed invested. When you look at monthly returns for the stock market it appears to be quite volatile but viewed over a longer period of time the market appears relatively tranquil. Having a long-term perspective may not be exciting but it has historically been an effective strategy...and made quite a few people wealthy. Below is the 1-month price return on the stock market going back to 1979. No doubt about it, the stock market has been quite volatile. I don't see that changing anytime soon. 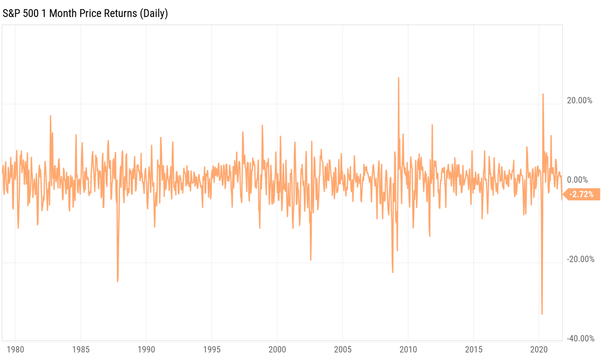 Rather than trying to time the market, smart investors focus on time IN the market, allowing their investment returns to compound year after year. The greatest investor of all time Warren Buffett as said, “Be greedy when others are fearful.” Back in 2014 during a market downturn, he said, “The more the market goes down the more I like to buy.” Like Warren Buffett, savvy investors take advantage of market volatility by buying quality stocks when there is a sell-off. In 2013, Warren Buffett gave a great example, he said, "It should be an enormous advantage for investors in stocks to have those wildly fluctuating valuations placed on their holdings—and for some investors, it is. After all, if a moody fellow with a farm bordering my property yelled out a price every day to me at which he would either buy my farm or sell me his—and those prices varied widely over short periods of time depending on his mental state—how in the world could I be other than benefited by his erratic behavior? If his daily shout-out was ridiculously low, and I had some spare cash, I would buy his farm." Similar to having a shopping list prepared before you leave your home for your favorite store; have a list of quality companies that you’d like to own when they go on sale. Buying stocks when they attractively priced could help enhance the long-term growth potential of your portfolio. For those investors who not only didn't sell during market volatility but actually purchased, these savvy investors ended up with more than 3x as much money. See the chart below. 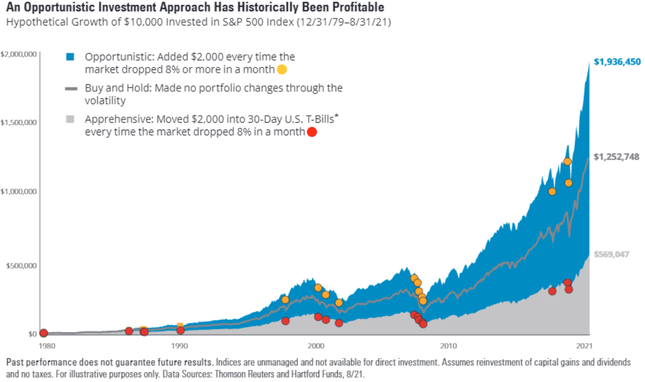 So what is the moral of the story? It can pay handsomely to zig when most others are zagging. -Paul R. Rossi, CFA  If you hold mutual funds, you are losing money that you don’t need to be losing due to the way they are structured. If we designated mutual funds with a number similar to what technology companies call their software versions, mutual funds could be considered “Version 1. 0.” The mutual fund structure is almost 100 year old technology. Some wine connoisseurs make the argument that certain wines get better with age, the same cannot be said about the mutual fund structure. Why haven’t you heard of this before? Because there are billions of dollars in management fees, research expenses, and trading costs that Wall Street would rather you not focus on. Structurally, mutual funds are not efficient. Are you aware that your neighbor down the street who you never talk to can directly affect your taxes? Yep. When you neighbor sells their mutual fund position the mutual fund manager must sell the underlying positions in the mutual fund to raise cash to then send to your neighbor. And since the fund sold the underlying positions to raise cash, if there was a gain, this gain can be passed along to you in the form of a taxable gain even though you didn’t sell your position. If this sounds a bit archaic, that’s because it is. You might ask, there has to be a better way? And you’d be right, there is a better way. It’s called an Exchange Traded Fund or ETF. I would call ETF’s the software equivalent of at least version 2.0. They are structurally completely different than mutual funds, but from an investors perspective they are effectively the same. They can hold a basket of securities (US stocks, foreign stocks, corporate bonds, commodities, US treasuries, etc.) just like mutual funds and allow investors to purchase and diversify very easily. A recently released Goldman Sachs paper reported that in 2019:
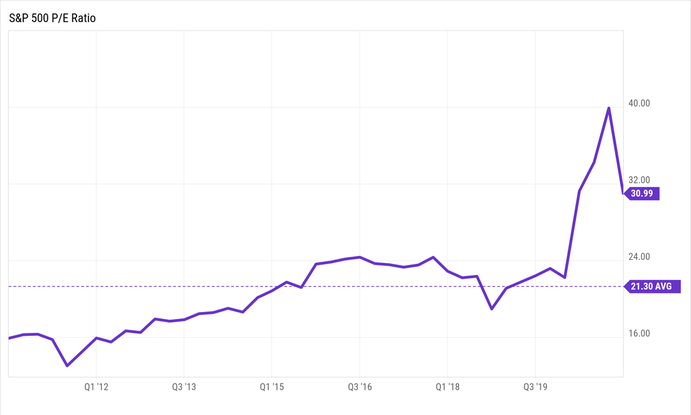
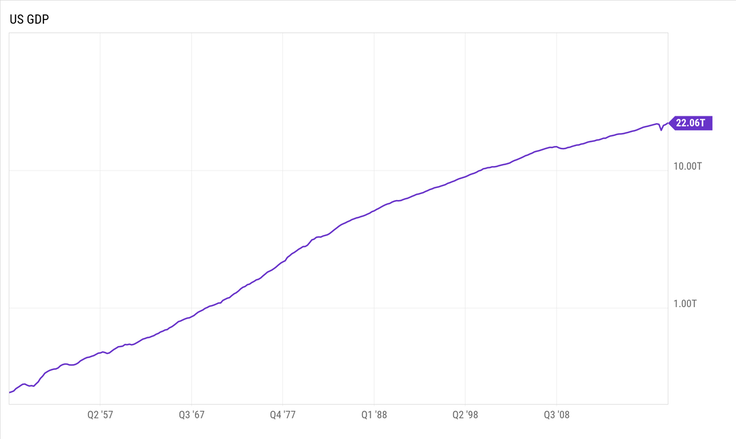
By using ETF's instead of mutual funds, investors can better control when they pay taxes, or in other words, pay when they sell their shares rather than when their neighbor (i.e., other shareholders) does. Similar to an iPhone software update, it's time to update your investment software. -Paul R. Rossi, CFA 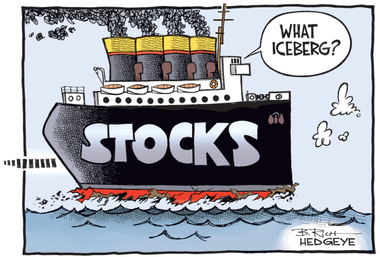 Since the stock market bottomed in 2009 (during the Financial Crisis), the US stock market has enjoyed an unbelievable ride higher with very few major corrections. In fact, from the March 2009 bottom, the market is up over 700%. With such a great, “seat of your pants” type of ride over the last decade, it might make sense to take a step back and assess where we are now. To offer some perspective on the stock market - below are five measures that illustrate where market valuations currently stand: 1. S&P 500 Price to Earnings Ratio (P/E Ratio) The S&P 500 P/E Ratio measures the combined price of all 500 Standard & Poor constituents against their aggregate earnings-per-share. Its latest reading is 25.39, which means investors are paying just over $25 for every dollar of earnings. The P/E ratio has historically been below 20, so this would suggest that the market is currently over-valued. However, when we look at the forecasted P/E, it is currently 21.87 which is more inline with historical averages. In addition to this: Lower interest rates can justify higher valuations, all else being equal - there is an inverse relationship between interest rates and valuations which I will write about in the future. Indicator Conclusion: Mildly Overvalued 2. S&P 500 Cyclically Adjusted P/E Ratio (CAPE Ratio) Similar to the P/E ratio, the CAPE ratio divides the S&P 500’s current price by its 10-year earnings, adjusted for inflation. Why adjust the traditional P/E Ratio? By using a 10-year period, this tends to smooth out year-to-year fluctuations in earnings which can be somewhat volatile over shorter periods of time. The idea is a higher CAPE ratio could reflect lower future returns, whereas a lower figure would indicate higher returns. The CAPE Ratio was developed by Noble prize winner Robert Shiller of Yale back in the 1990’s; however, this idea is not exactly new, Benjamin Graham (the father of value investing) and David Dodd recommended using 7-10 year averages in their seminal 1934 book Security Analysis when using valuation ratios. There is some research that shows over long periods of time this ratio tends to predict future long-term returns fairly well. However, the CAPE ratio isn’t expected to predict what the market might do over short periods of time. Having said that, large spikes in the CAPE ratio have often preceded recessions, and it’s important to realize that the metric is currently approaching its highest level on record. The CAPE ratio currently stands at 38, which is 26% higher than its 5-year average, 40% higher than its 10-year average, and more than double its 100-year average. Indicator Conclusion: Significantly Overvalued 3. The Buffett Indicator In 2001 Warren Buffett said that US Market Capitalization as a percentage of GDP is “probably the best single measure of where valuations stand at any given moment,” The ratio measures the aggregate value of the US stock market relative to the country’s economic output. Where is it now? It is currently at its highest level ever. Investors are paying over $2 for every dollar of US GDP, compared to a long-term average of $0.82. Buffett went on to say, "for me…if the percentage relationship falls to the 70% or 80% area, buying stocks is likely to work very well for you. If the ratio approaches 200%–as it did in 1999 and a part of 2000–you are playing with fire" I’m not one to argue with Buffett’s thoughts, so this isn’t a great sign. Indicator Conclusion: Significantly Overvalued 4. S&P 500 Dividend Yield The dividend yield is the aggregate dividend of all the companies in the S&P 500 divided by the price of the S&P 500. Basically, this is how much the 500 largest US companies are paying investors in terms of dividends. All else being equal, a low or falling dividend yield means high or rising share prices. Currently the S&P 500 dividend yield is at a 20-year low. Over the last 10-years it has hovered between 1.75% - 2.25%, it’s currently at 1.26%. And there are only two ways for this number to increase, either dividends increase, or stock prices drop. I know which one I’d prefer. Indicator Conclusion: Overvalued 5. The Yield Curve Long-term treasury rates are almost always higher than those of shorter-term rates. Why? Because investors expect to be compensated for lending money over longer periods of time due to risk and the time value of money. However, when shorter-term rates are higher than longer-term rates - the opposite of what is “normal”, it signals shaky confidence in the economy, and typically leads investors to shift from riskier assets to safer assets, in essence moving from stocks to bonds. This phenomenon, known as an inverted yield curve, has rather consistently foreshadowed recessions and market downturns. A popular yield curve measure used by the market is the spread between the 10-year treasury vs. the 2-year treasury. Just before the last four recessions, the 10-2 spread went negative and the stock market turned negative shortly thereafter. The good news is currently the yield curve is “normal” with the 10-2 spread sitting right around its historical average. Indicator Conclusion: Normal Is a Market Correction Coming? The short answer is yes. Why? Because corrections happen somewhat regularly. Since the Financial Crisis there have been 4 corrections of 15% or greater, with 1 of these 4 corrections being the Covid correction of over 30%. Not only can corrections occur by prices dropping, but corrections can also come from prices staying flat (for years) despite company growth—rising earnings, sales, book value, among others without price increases (think the 1970’s). Either way, the market has always ebbed and flowed over time, oscillating between overvaluation and corrections, but the long-term trend is positive if you have the time. While I don’t advise dancing in and out of the market based upon headline news. I do think it’s prudent to have some understanding of where we might be in terms of the economic cycle and market valuations. Why is this prudent? This gives you a good reason to take some time to thoroughly review what you own, why you own it, and what the future might realistically hold for your portfolio. Having realistic expectations is fundamental to successful investing. With valuations where they are currently, it would be well-advised to use this to temper your future return expectations. If you have a well-thought out, well-designed portfolio coupled with a rock-solid financial plan then you shouldn’t be overly concerned with market fluctuations. Although, that’s a big “if.” -Paul R. Rossi, CFA  I’m a huge proponent of self-improvement and growth. The idea of making small improvements compounds over time and can become extremely meaningful. Let me give you an example: Most people would agree that typically making a 1% improvement isn’t much of an improvement. And I would agree. On the other end of the spectrum, a 100% or 200% or even 1,000% improvement is quite substantial. However, what if you are able to make many 1% improvements over time, this is where things get quite interesting. Assume you are able to make a 1% improvement everyday for just 1 year. How much do you think you would improve? 50% 100% 365% These would all be great improvements, but the actual answer would be a 3,788% improvement. At the end of a year you would be over 37 times better than you were when you started. All from just a 1% improvement every day. The formula is: (1 + 0.01) ^ 365 This is an example of the power of compound growth. Einstein has been attributed to saying, “compound interest (growth) is the 8th wonder of the world.” And even if he didn’t say it, I’m sure he would agree with this idea. Compound growth is incredibly powerful and is quite possibly under appreciated by most people outside of mathematicians and athletes. One such person who I’m confident understands the power of continuous improvement is Wayne Gretzky. It truly is hard to comprehend just how great Wayne Gretzky was on the ice. He made the All-National Hockey League First-Team 8 times, holds the record for most points all-time, most points in a season, most all-time assists, youngest player to score 50 points, most game winning goals in play-offs, and the list goes on and on. He retired in 1999 and STILL holds 60 records in the NHL. And if you can’t remember all his amazing records, you can just call him by his moniker, “The Great One.” He understood the idea of continuous improvement, hard work, and living a fulfilled life. Here are some of his own words on these subjects.
We all can't be Wayne Gretzky, but we can strive to take his ideas and incorporate them in our lives. -Paul R. Rossi, CFA  It wasn't easy, but here's a list of some of my favorite Warren Buffett quotes I compiled. What made this so hard? Choosing just 25 made it hard, I could have easily come up with a list of several hundred. How did I come up with this list? I went through several books I have about him and numerous shareholder letter's he's written over the years and used quotes that gave a broad range of invaluable insights to living a happy healthy life. A person would be hard pressed to not do well if they lived by his way of thinking. Some of my thoughts are in italics. So here they are: The 25 Greatest Quotes of Warren Buffett
-Paul R. Rossi, CFA
 It’s easy to get a bit mixed up by the many moving parts and features of Medicare. This article hopes to help you make sense of the alphabet soup which is known as Medicare. Quick note: At the bottom of this article, I've included a 2-page PDF tear sheet that can be downloaded, printed off for future use, or worst case, on those nights you are having difficulty falling asleep, it can be used as a sleeping aid. The information below provides some information on the major coverage options, called parts A, B, C, D, and some of their more significant aspects. Use it to help you think about what level and combination of coverage suits you and your family the best. Medicare Part A (hospital coverage): Part A is the portion of Medicare that pays hospital costs. Part A also includes some benefits for skilled home care, hospice care, and the first 100 days of skilled nursing care. You probably won’t have to pay any premiums for Part A, because you already paid for it with payroll taxes while you were working. In 2021, you have to pay the first $1,484 of the cost of each hospital stay. Part A covers the rest for the first 60 days, and then you pay the first $371 per day for days 61–90. After that, there are “lifetime reserve” days (you have a total of 60 days to use in your lifetime, and then they are done), for which you pay the first $742 per day. You are responsible for the full cost of any additional days. Medicare Part B (medical coverage): Part B is the portion of Medicare that covers outpatient health care visits such as doctors, outpatient surgery, diagnostic testing, durable medical equipment, and ambulance services. Part B is not free. You’ll pay premiums ($148.50 per month in 2021)—and if your income is over a certain amount, your premiums are subject to surcharges. These surcharges are based upon your modified adjusted gross income as reported on your IRS tax return from 2 years ago, which can be as much as $504.90 per month for income above $500,000. Under Part B, you are responsible for the first $203 of covered medical services. Once that deductible is met each year, you will typically owe 20% of the cost of such services, although you may also owe “excess charges” for some providers. Medicare Part C (Medicare Advantage): Part C plans are private plans that contract with Medicare to provide Medicare A and B benefits. Many of these bundled plans are available for only the cost of the standard Part B premium. More than 60% of Medicare Advantage enrollees are in HMO plans, with the vast majority of the rest in PPO plans. Medicare Part D (prescription drug coverage): Part D plans are optional prescription drug plans available to everyone who has Medicare. These private plans contract with Medicare to provide at least a standard level of prescription coverage. They are available both as stand-alone plans and as part of Part C (Medicare Advantage) plans. Premiums vary, and there are surcharges for those with higher incomes, but as of 2021, they ranged from $12.30 to $77.10 per month. *Medicare Supplemental Insurance (Medigap). Medigap policies are private policies designed to cover expenses not covered under Part A or Part B (above). To make things confusing they follow standardized forms, designated with letters A through N. Medigap policies add to the “alphabet soup” confusion. Example: Medicare Part A and Medigap Plan A are not the same thing. Any Medigap policy designated with a particular letter provides a specific set of benefits, regardless of which company issues it. It's important when approaching 65 years of age that you do your research to determine what is best for you and your family. Action Item Generally when you turn 65, this is called your Initial Enrollment Period. It lasts for 7 months, starting 3 months before you turn 65, and ending 3 months after the month you turn 65. If you miss your 7-month Initial Enrollment Period, you may have to wait to sign up and pay a monthly late enrollment penalty for as long as you have Part B coverage. The penalty goes up the longer you wait. You may also have to pay a penalty if you have to pay a Part A premium, also called “Premium-Part A.” Regardless of which Medicare option you choose, you need to do it in a timely manner. Otherwise, you could encounter periods of time when you,
This is something you don't want to miss, put a reminder in your phone. In fact, I would recommend a full 6-months before you turn 65, you start your Medicare research so by the time you are in the 7-month Initial Enrollment Period you can sign up and you'll will know exactly what options you'd like and you'll have a good idea of all the costs. To do your research and for a more complete description of costs, what is and is not covered visit www.medicare.gov - Paul R. Rossi, CFA
 As Warren Buffett's quote above refers to, risk is not knowing or understanding what you are doing. To help combat this "risk," I’ve put together a list of some important measures to consider when evaluating your investment portfolio. These metrics can be used to measure individual stocks, ETFs, and mutual funds. Underlying Holdings: Probably the single most important information to know. This is the driver of how your portfolio (or the fund) has performed in the past and how it will perform in the future. Know what you own and why. Geographic Exposure: Measures where in the world are the funds’ largest holdings located geographically. Where are these companies based? Are they located in U.S., European, or in Asia? Why is this important? Different countries have different accounting standards, regulatory requirements, and governmental intervention. Weighted Average PE Ratio: Measures what the weighed average price/earnings ratio is of the funds’ underlying holdings. The higher the number, the more investors are paying for every dollar of earnings. All else being equal, lower is better. Valuation Percentage: The valuation percentage shows how far above or below its current price the stocks or funds historical valuation is. This factors a long-term average of the Price to Sales Ratio and Price to Earnings Ratio and mathematically determines whether the current price is high or low relative to those historic valuation multiples. A negative value indicates the current price is above the historical valuation while a positive value indicates it is currently trading at a discount to the historical valuation. This is NOT a measurement of how the stock's price relates to its "intrinsic value” but is instead a measurement of how the market is valuing the stock or fund relative to how it was valued historically. Return on Equity (ROE): Measures the rate of return on the money invested by stock owners. ROE shows how well a company uses investment funds to generate income and growth. Return on equity is useful for comparing companies within a sector and industry. It’s also useful at the fund and portfolio level. Return on Equity = Net Income / Average Common Shareholder's Equity. All else being equal, higher is better. Dividend Yield (and Current Yield): The sum of all dividends paid (and interest paid), divided by current share price; a higher dividend yield (and current yield) indicates a larger payout. Dividend Payout Ratio: The percentage of company net income paid as dividends to shareholders. Typically, investors who want income from their investments favor a higher dividend payout ratio. Dividend Growth: Period over period growth of dividends paid, usually expressed as trailing 12-month (TTM) growth. Growth in dividends can be a sign of strong financial health. Dividend Consistency: The track record of paying dividends to shareholders at a regular interval, usually quarterly, over a given lookback period; a company cutting or canceling a dividend payment is a negative event. Total Returns: Unlike price return, total return includes dividends and interest in addition to price appreciation; a higher total return is better. It’s important to look over various time periods and under various market conditions (Bull markets, Bear markets, and sideways markets). As I’m sure you’ve heard before, “past returns are no guarantee of future returns.” Sharpe Ratio: The Sharpe Ratio measures the risk-adjusted return of a security. This is a useful metric for analyzing the return you are receiving on a security in comparison to the amount of volatility expected. Sharpe Ratio is measured as annualized return on Lookback Period - Risk-Free Rate) / Historical Annualized Standard Deviation of Monthly Price Returns. Benchmark: For a security, a fund, or a portfolio, a benchmark is used to track against. Generally, the benchmark is an index or weighted return stream of multiple indices that help give an idea of what your investment should strive to match or beat. Measuring against the proper benchmark is critical to properly understanding performance and risk. Benchmarks are also used to calculate risk metrics like Alpha, Sharpe Ratio, and Beta for securities and portfolios. Upside/Downside Capture Ratio: The upside/downside capture ratio measures the ratio of the upside and downside of an investment vs a benchmark. This ratio explains how an investment typically performs in relation to their benchmark index. An upside/downside ratio of 100 means that the investment typically performs the same as the benchmark, regardless of if it is rising or falling. If the benchmark increases by 10%, the investment increases by 10%. If the benchmark decreases by 5%, the investment decreases by 5%. Sometimes, an investment may rise 15% when their benchmark rises by 10% but falls 12% when the market falls 10%. In this case, we calculate the upside/downside capture ratio by dividing the investment's upside return and dividing by the downside return: (.15/.10)/(.12/.10) = 1.25. Multiplying this by 100 gives us an upside/downside capture ratio of 125 for this investment. All else being equal, higher is better. Expense Ratio: The percentage of fund assets that shareholders pay as management fees and operating expenses. A lower expense ratio means less fees. All else being equal, lower is better. Market Cap Allocation: The percentage of fund assets invested in large-cap, mid-cap, and small-cap stocks. Understanding what you own and why is critically important. What I argue is even more important is understanding that having 100% accuracy to what the future holds is impossible, so taking measured risks is really what investors are doing when they invest. As Napoleon said, "Nothing is more difficult, and therefore more precious, than to be able to decide." -Paul R. Rossi, CFA  What is Portfolio Rebalancing? Portfolio rebalancing is the systematic process of periodically realigning an investment portfolio’s actual allocations with the allocation percentages that were originally planned. This is accomplished by reducing positions that have become an outsized percentage of the portfolio (due to relative outperformance) or increasing positions that make up a lesser-than ideal percentage of total holdings (due to relative underperformance). Why is this done? Typically, it’s done to ensure the portfolio matches an investors risk tolerance, time horizon, and goals. Some things to consider when rebalancing:
The two most commonly used rebalancing policies are based on:
So which strategy is best for managing risk and maximizing performance? A research platform I use within my own financial planning business has recently done a deep dive into this particularly important question that I thought was interesting. The research was conducted using 6 different rebalancing strategies, each beginning with a broad based 60% equity (stock) and 40% fixed income (bond) portfolio.
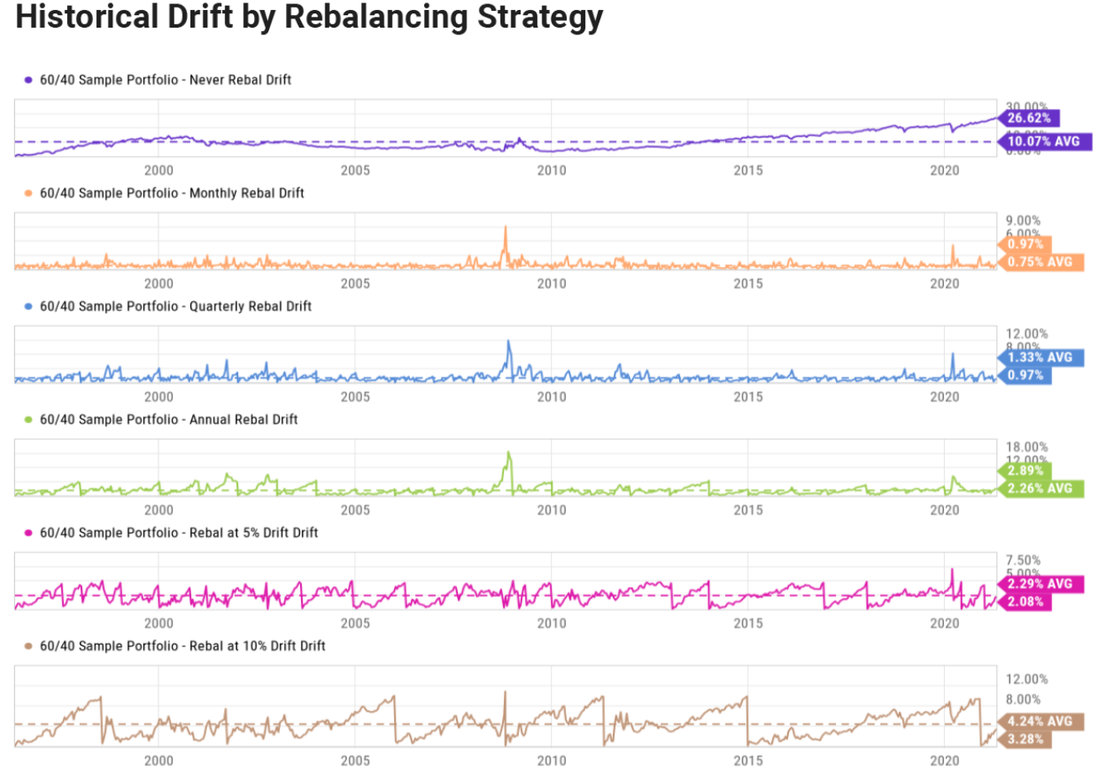 Each of the 6 portfolio rebalancing strategies was studied over a 25 year period, the analysis looked at performance and volatility. This 25 year period includes four bull markets and three bear markets. The findings show the pros and cons of different rebalancing policies and may inform your own best practices for portfolio management. Some of the questions that were answered are:
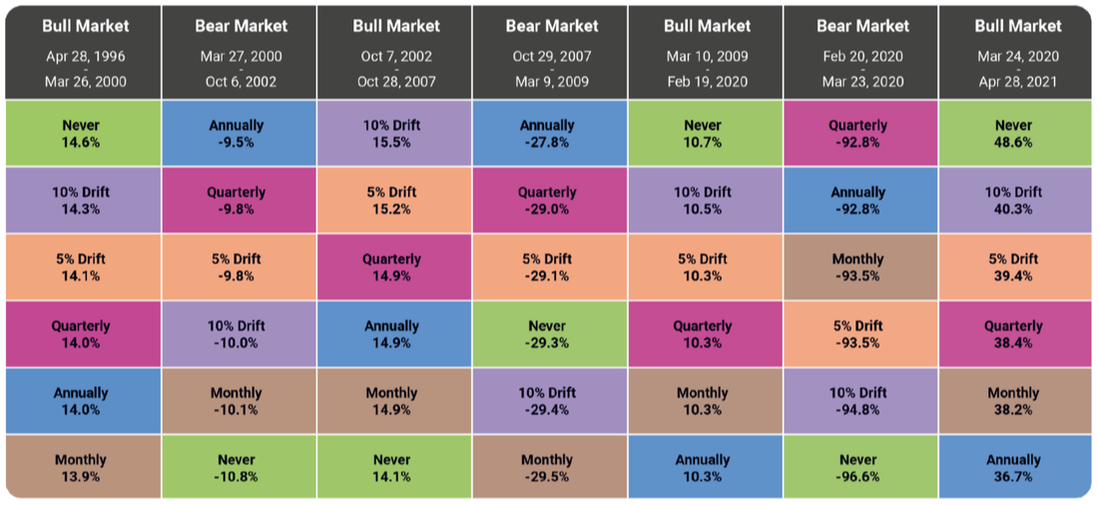 Key Findings
Conclusion On a cumulative basis, rebalancing strategies that rely on the triggering of drift thresholds outperform those with rebalancing strategies based on calendar frequencies. And while portfolios that never rebalance do perform relatively well over time, such a strategy can miss out on secular growth if only a small percentage is allocated to asset classes that eventually become market leaders, even if only temporarily. While more frequent rebalancing keeps actual portfolio allocations more in line with target allocations, the risk-management benefits diminish when a portfolio is rebalanced too frequently. The optimal rebalancing strategy for managing risk, maximizing performance, and minimizing costs will change over time, based in part on market conditions. However, more important than any of these factors is your comfort level with the chosen rebalancing strategy and your comprehensive financial plan. As is often said, "peace of mind can be priceless." -Paul R. Rossi, CFA  Probably and Potentially Quite a Bit - read on Below are some questions that you should review as Biden's proposed tax plan might have dramatic implications for you and your family. Do you make pre-tax contributions to traditional retirement accounts (e.g., a 401(k) or IRA)?
Do you hold appreciated assets with a low cost basis (excluding pre-tax assets such as IRAs, most annuities, and other items of income in respect of a decedent)?
Do you earn wages in excess of $400,000?
Does your household income exceed $400,000?
Does your household income exceed $1,000,000?
Does the value of your estate exceed $3.5 million (or $7 million, if you are married)?
Are you a small business owner?
Are you an informal caregiver for an individual in need of long-term care services?
Do you have significant corporate ownership interests?
As always, it's important to talk with a tax professional to ensure you are making the best decision for your own particular situation. -Paul R. Rossi, CFA 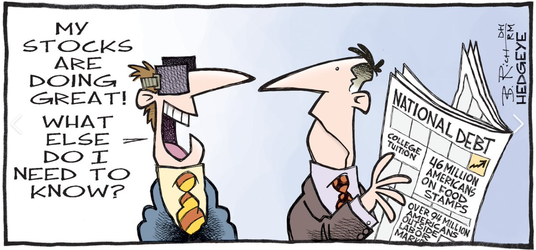 Several determinants play a critical role in why some individuals become value-oriented investors and others become growth-oriented investors. With so much research being done on various aspects of investing, surprisingly little effort has been made to explain the factors that influence individual investors’ decision making. The authors (Nerik Cronq, Stephan Siegel, and Frank Yushow) whose published work was in the 'Journal of Financial Economics' shows that an investor’s investment style (i.e., value versus growth) can be derived from two sources: a genetic or biological predisposition and environmental factors. The authors reference several previous studies and provide their own analysis to contribute a new perspective about why investors gravitate toward value or growth investments. Differences in individual investor behavior stem from:
Several factors explain an individual investor’s investment preference for either value- or growth-oriented portfolios. The authors estimate that genetic differences account for approximately 26% of the orientation when measured by Price/Earnings ratio and 27% when measured by Morningstar’s Value-Growth Score. This result is consistent with the findings of previous researchers, who have shown that approximately 30% of the cross-sectional variation in financial risk preferences is explained by genetic predispositions. In addition to biological considerations, the analysis demonstrates that particular individual life experiences have a large impact on investment styles. For example:
Significant macroeconomic events (think of Global Financial Crisis, Dotcom Bubble, etc.) that investors experience can also have long-term and persistent effects on that individual’s behavior much later in life.
Conversely and consistent with previous studies, the research find that investors with:
Additionally,
This research contributes to and supports the growing body of evidence regarding behavioral finance, which demonstrates that life experiences, behavioral biases, and genetics have a dramatic impact on investors’ behavior. This research, coupled with the growing body of literature on cognitive biases can be extremely helpful for individual investors to help understand their tendencies and why they may lean toward various investment strategies or products. By digging a bit deeper and learning more about ourselves, we can make better informed decisions. -Paul R. Rossi, CFA 
Every day we’re bombarded with reports of what’s hot and what’s not – fueling a Fear-Of-Missing-Out (FOMO). Fear of missing out is a phenomenon that affects many aspects of our daily lives, and it’s far more prevalent than you might think. In fact, FOMO was added to the Oxford English Online Dictionary in 2013, along with such other contemporary expressions as selfie and twerk. The emergence of social media has only compounded the FOMO effect. The anxiety that we feel when we believe something better is happening elsewhere is ubiquitous, and investors are especially susceptible to its influence. Why? Because who doesn’t want to make money fast? In fact, Wall Street has embraced our susceptibility to this weakness and created an investment fund with FOMO in its name. Unfortunately, FOMO and your investments are a combustible combination, similar to mixing bleach and ammonia together, a very deadly recipe. And something to avoid at all cost. At some point, you’ll likely hear your neighbor, your friend, your friends friend, your co-worker, or somebody who made a lot of money quickly. If you are like most people, you’ll likely want to follow whatever they did. Why? Because your investments aren’t achieving the same results. Almost by definition, a well-built “all-weather” portfolio will never achieve stellar results over the very short-term; however, the superpower of this type of investing is in the strategy’s ability to do extraordinarily well over time, just ask Warren Buffett, Peter Lynch, or Sir John Templeton. There’s a huge temptation to change course and invest in the latest hot streak. Fueling this urge is what’s called recency bias, a well-known cognitive bias that says: what’s happened most recently is more readily available in the mind and therefore the recent past = the future. But changing your investment strategy to take advantage of a run that has already taken place isn’t a sound investing strategy, it’s FOMO and recency bias working against you. You can think of this way: Many times, this strategy would have you selling assets that may be undervalued, in order to buy expensive assets that have already gone up. This is buying high and selling low, which is the exact opposite of what you want to do, which is buy low and sell high. Don’t be Fooled by FOMO History is littered with examples of hot trends that reversed.
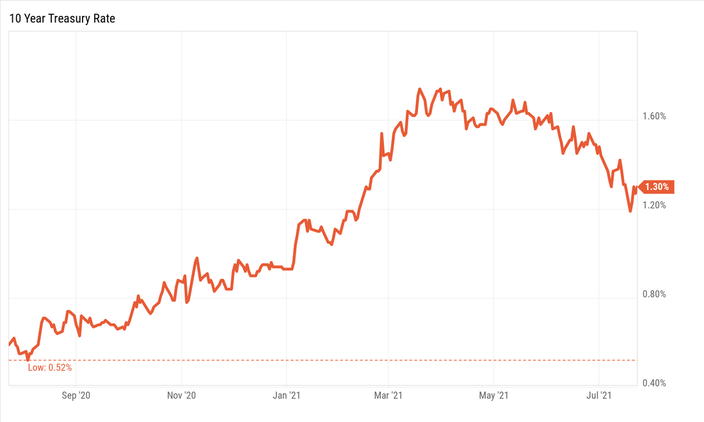
In each case, FOMO caused investors to be more afraid of missing out than what the potential loses could be. In hindsight, for those people who changed their long-term investment strategy it was a serious and costly error. When everyone from those in the media to your own acquaintances tells you to place heavy bets on one or more “hot” stock or sector that has recently done well, be wary. Be very wary. How does a wise investor avoid falling prey to FOMO? Remember the simple adage: “If it sounds too good to be true, then it probably is.” -Paul R. Rossi, CFA 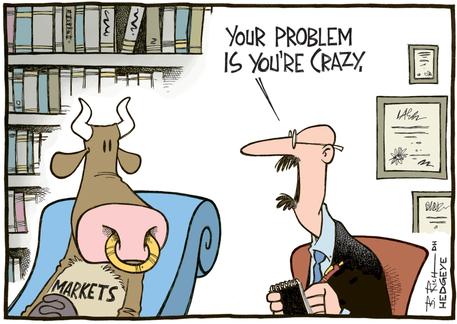 It’s a debate raging across the country that seemingly everyone has an opinion about. From Main Street to Wall Street, everyone wants to know; will the U.S. stock market suffer a severe correction or keep grinding higher? Let’s examine a couple of valid arguments why the U.S. stock market might keep charging higher between now and the end of the year. Reason #1: Earnings have come roaring back from the recent pandemic induced recession. EPS (Earnings Per Share) on the S&P 500 are at an all-time high. The 500 largest public companies in the U.S. generated earnings that are up 29% from pre-pandemic levels (2020) and are up 386% from the depths of the forced shutdown. In a nutshell, the largest U.S. companies have never earned more money than they are earning today. I repeat, the largest U.S. companies have never earned more money than right now. Mic drop. And it's growth in earnings per share that drive stock prices up. See chart below, 32+ years of Earnings Per Share - it's never been higher. 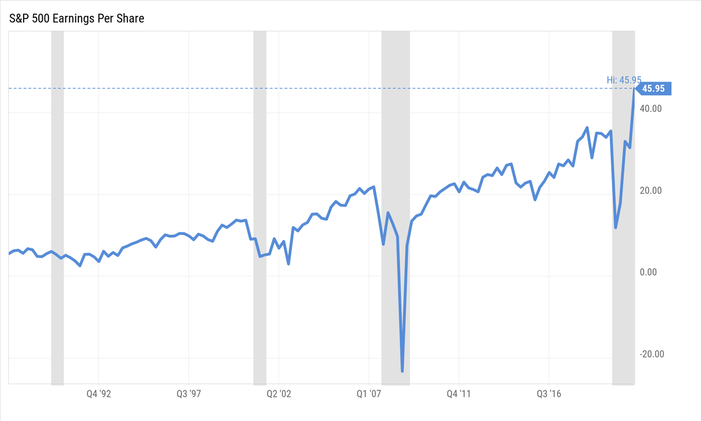 Reason #2: Interest rates are extremely low (from a historical perspective). Interest rates to valuations are like what gravity is to matter, they are inextricably linked. The higher the level of interest rates, the lower the value of future earnings are worth today, and therefore a downward pull on stock prices. At the same time, higher rates add to the interest on mortgages, business loans, and corporate bonds, which makes it more expensive and harder for individuals and businesses to borrow money. With that said, interest rates are at some of the lowest levels going back decades. Take a look at 10-year Treasury rates over the past 30+ years. 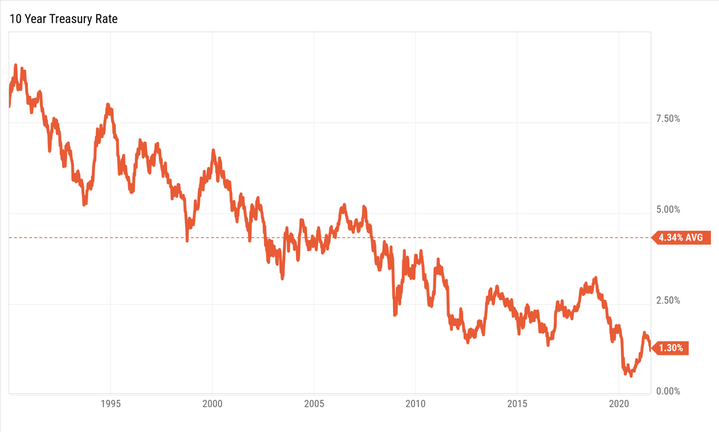 |
||||||||