|
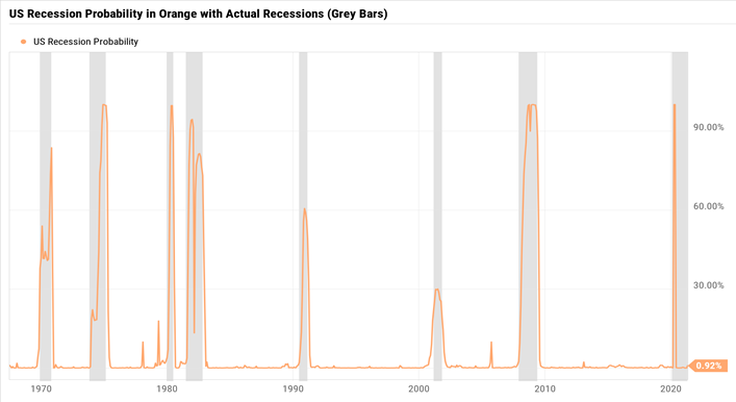
I'm not sure anyone can accurately predict recessions, the stock market, or anything else with 100% certainty...especially when it involves human interaction, but looking at key economic data might be able to provide some measured insight as to what the future may hold. Professor Jeremy Piger of the University of Oregon maintains a recession model that might just be able to do just that...provide some probabilistic numbers to what the economy might experience in the near-term. The chart below shows the last 50+ years of U.S. recessions (grey bars). In addition to the grey bars, the orange line is what the professor has produced, called the, "U.S. Recession Probabilities" (Chauvet and Piger) which uses smoothed probabilities of a recession in the U.S. It is calculated from a dynamic factor Markov-switching model using four economic inputs:
Over the last 50 years, the U.S. has experienced 8 recessions, including our most recent 2020 Covid recession. My personal prediction is that we will continue to experience recessions going forward...so if nothing else, get used to hearing that another recession is just around the corner, because it probably is. And if the last 50 years is any guide, we can expect a recession about every 6 to 7 years. While I don't advocate jumping in and out of the market based upon recent headline news, I do believe understanding where we are in the economic cycle can be valuable for a number of reasons. Here are just a few:
While there is no absolute silver bullet to forecasting certainty, the "U.S. Recession Probability" model is a bullet none-the-less, and it never hurts to have another tool in the tool belt. -Paul R. Rossi, CFA Click here to go to Dr. Piger's website and the Recession Probabilities Model.
0 Comments
Your comment will be posted after it is approved.
Leave a Reply. |

