|
Stock markets around the world rallied in the second quarter of 2020, recouping much of the ground lost in the first quarter of the year as the Coronavirus pandemic shook the overall economy and dominated headlines. The tech dominated Nasdaq Composite Index returned to all-time high territory in June while the S&P 500 and Dow 30 ended the quarter 7% and 11% off previous highs respectively. The strong stock market amidst all the uncertainty in the economy has been a head-scratcher for many. Below we’ll look at the performance of different sectors, several asset classes, some leading and lagging economic indicators, and some of the government policy that has been implemented – all of which may help to shed some light on these confusing times. The stock market has mostly reinforced a few of the guiding principals we should all remember: markets are not predictable in the short term, stock prices are driven purely by supply and demand, and while markets are influenced by the broader economy they are not directly linked. 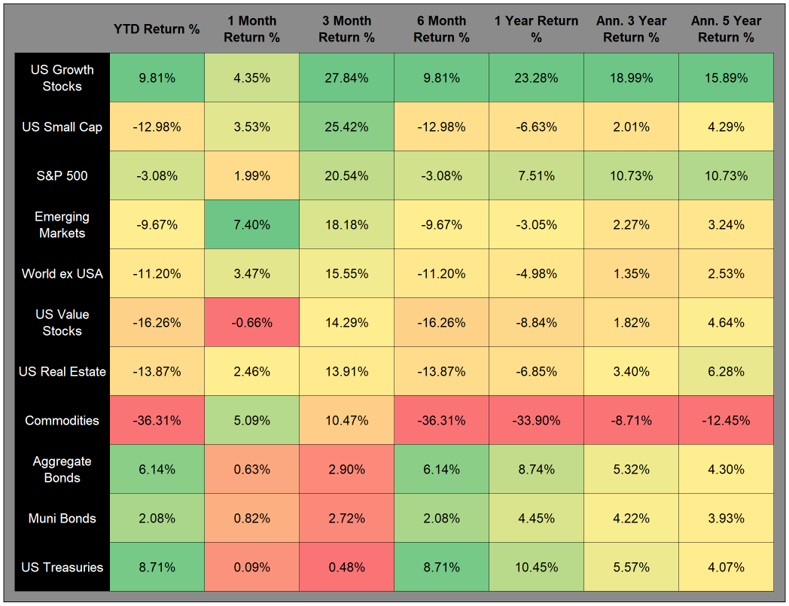 When we looked at asset class performance in the first quarter of 2020, exposure to treasuries and other bonds was a big focus. Fixed income was protecting downside and providing returns with negative correlation to stock market results, reducing overall portfolio risk. In the second quarter higher risk assets made a comeback and bonds lagged. Commodities and real estate gained back some of the ground lost in the first quarter but still have largely negative returns year-to-date. Value stocks continued to underperform those in growth indices while small caps edged out larger companies. The volatile markets of 2020 seem to be benefitting the assets on the far ends of the risk spectrum more so than those considered moderate. With more volatility likely due to uncertain macro events, remaining diversified looks to be a wise decision. 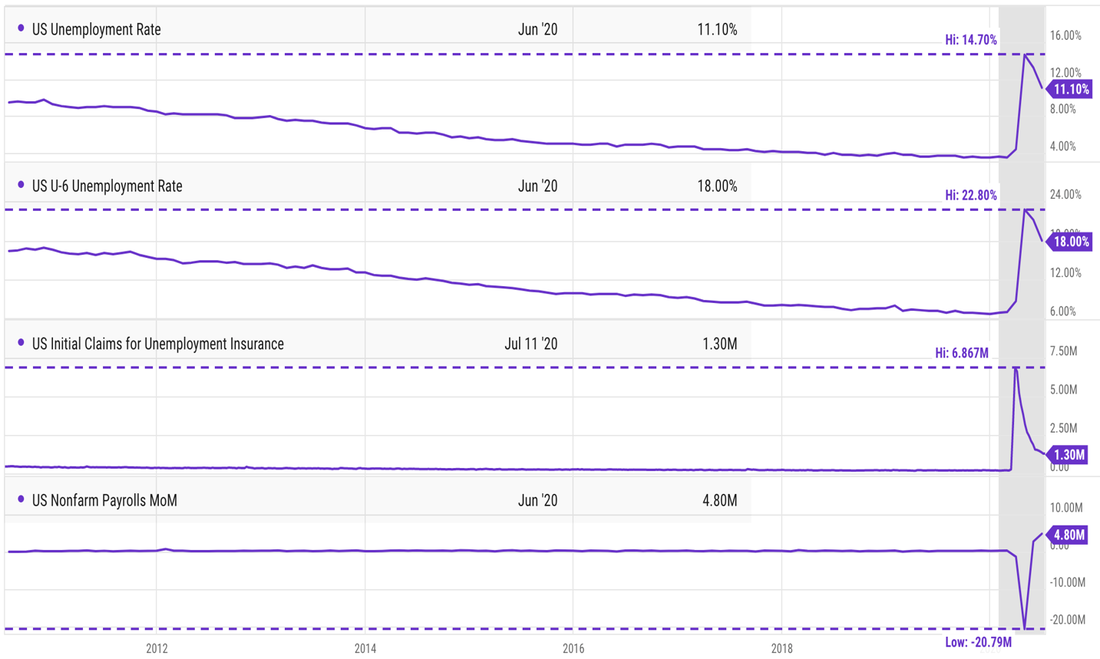 2020 has proven to be a year of extremely volatile employment data. We’ve seen swings of unprecedented values as record numbers of workers applied for unemployment insurance and subsequently returned back to work at some capacity. The U-6 data on this chart includes “under-employed” persons as well as unemployed indicating that a large number of people are working but earning less than they would at full employment. While initial claims are much lower than they were a few months ago, we’ve still seen 17 straight weeks with more than 1 million people filing for benefits. With the extended unemployment benefit scheduled to cease soon, it will be a number we’re keeping an eye on each week. 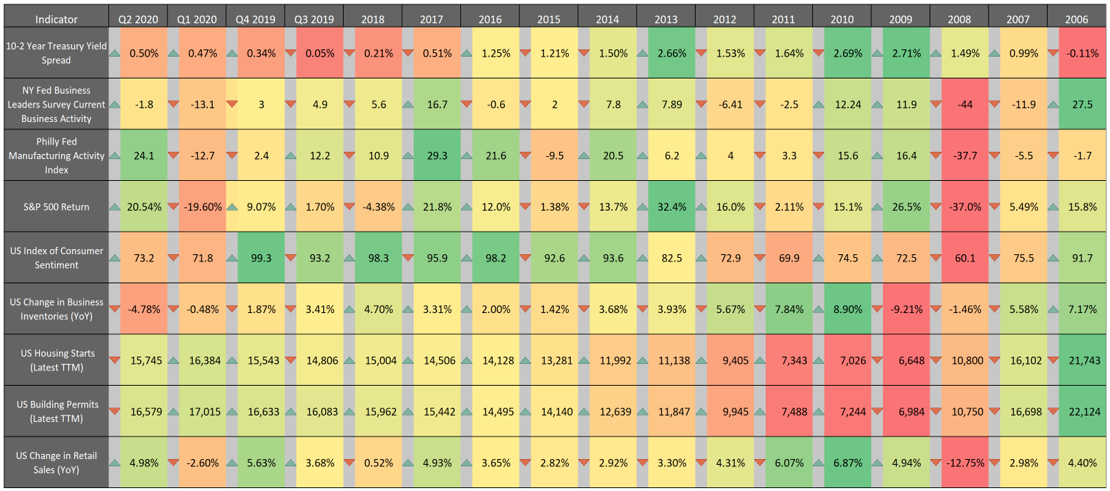 Most leading indicators moved in a positive direction based on the data released in the last 3 months. Manufacturing saw an impressively big uptick after a few months of slumping activity. Housing data showed some modest declines, but mostly due to upward revisions on past data. Retail sales and consumer sentiment both moved in the right direction, but the latter is still significantly lower than highs from pre-recession times. 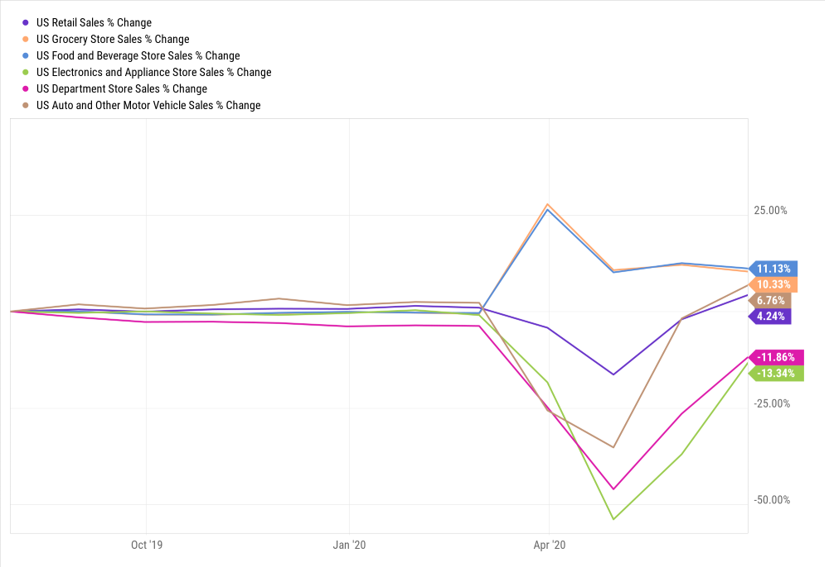 A closer look at retail sales data indicates that spending patterns are returning to normal. At the height of the COVID recession we saw spending on food and groceries jump while all other types of spending declined sharply. These trends seem to be trending back to usual levels now in both regards. 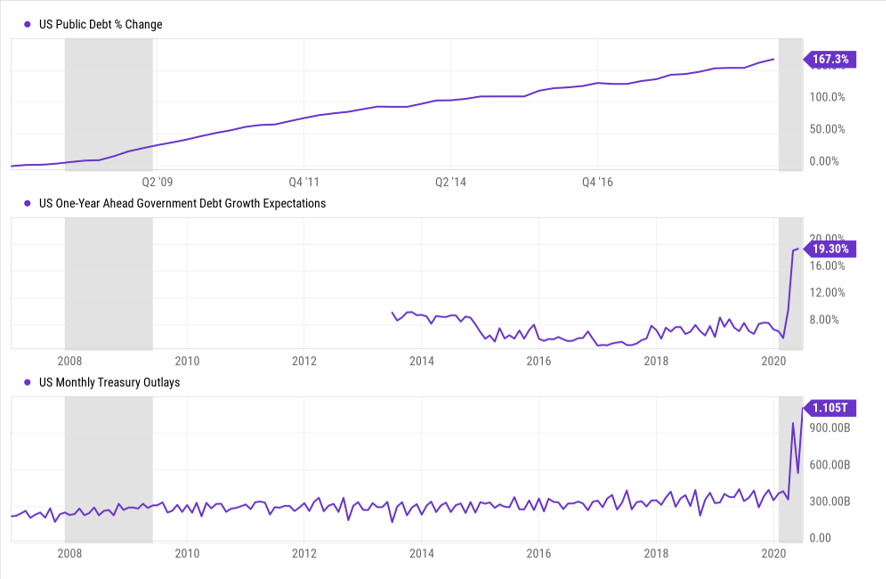 It’s been a time of record stimulus and spending as the US Government has been looking for ways to minimize the impact of coronavirus shutdowns on businesses and the American people. We’ve yet to see the data released on the total US public debt but expectations are that it will grow by a whopping 19% over the next 12 months. Treasury outlays have also been significantly higher than ever before, dwarfing anything from the 2008 financial crisis recession. 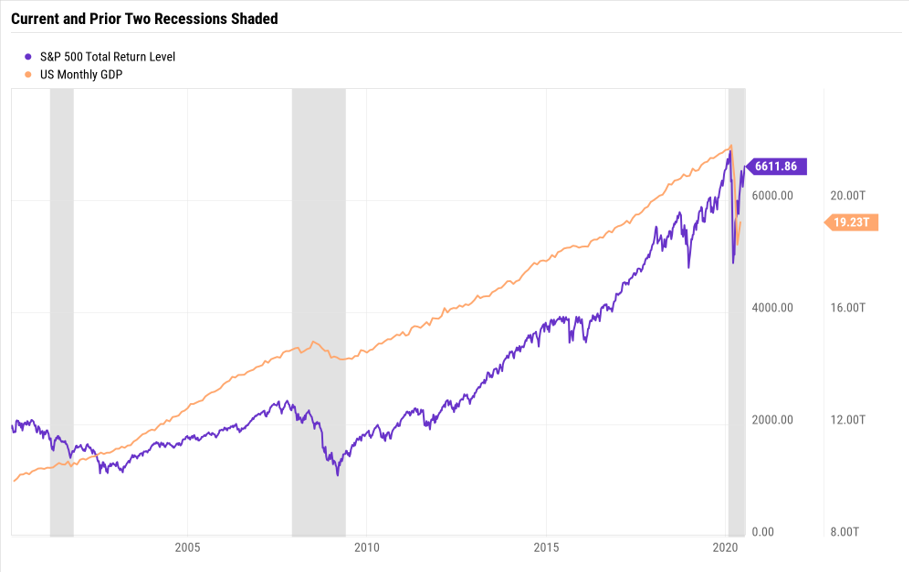 Here we have a chart showing stock market values and GDP over the current recession so far as well as the past two recessions (in grey). The magnitudes of movements in both this time around are apparent from looking at this chart. The “V” shaped recovery that seems to be taking place in the stock market is yet to be seen from a GDP perspective.
In summary the stock market has mostly reinforced a few of the guiding principals we should all remember: markets and the economy are not predictable in the short term, and having a well thought out financial plan is critical to your long-term financial health.
0 Comments
 What does it take for someone to put their capital at risk and entrust their funds to someone else to manage?
Trust is a multi-layered concept, and it is essential to the proper functioning of capital markets. Without it, financial interactions would become more inefficient and costly or cease altogether. In this fourth edition of the CFA Institute investor trust study, we examine how trust in the industry has evolved, while the essential characteristics of trust endure. CFA Institute began studying investor trust in 2013. The purpose of this study, the fourth in the series on trust, is to gauge the perceptions of investors toward the behavior of investment firms and professionals who are entrusted with their money. The findings should provide a guide for the industry to better serve its clients. We have seen how trust in the industry has evolved over time but also how the essential characteristics of trust endure. Trust must be built over time, yet it can be easily broken. The two major components of trust are credibility and professionalism. Credibility factors can be thought of as observable signals of trust. They are relatively straightforward to identify and provide mental shortcuts to indicate a trustworthy person or organization. Credibility can be demonstrated and earned, but it can also be assigned by a trustworthy source. Please click the link below to get a copy of the 32-page report. No email required. trust.cfainstitute.org/wp-content/uploads/2020/05/CFAI_TrustReport2020_FINAL.pdf  Over the years, we've all heard the doom and gloom from all sorts of so-called market experts. Here's a very short list of some of what you might have heard:
Doom and gloom sound bites make headlines, help sell complex expensive investment products and fit nicely in the 240 character limit on Twitter. But other than that, most of the time they aren't good for much, except for creating fear. There is volatility in the stock market, there is no denying that. And there always will be. Period. In fact, any market where people are involved there will be volatility, but taking a well thought out approach to investing and financial plannning has proven to do very well over time. Volatility and not having absolute certainty about the future is a feature of investing, not a bug. The sooner you get used to it, the better off you'll be. There is always a reason not to invest...do it anyway. Your older wealthier self will thank you. Most people have been accustomed to believing that the more you pay for something the higher the quality to be received. And in many areas of life, this is very well true. You can think of expensive German cars vs. less expensive domestic cars. Step into a high-end department store and get fitted for a custom suit vs. off the rack discount store and you can immediately "feel" the difference. From restaurants, autos, clothes, and electronics, the list goes on and on; pay more, and you can expect to receive a better product or service. Well confusing to most people, this idea does not hold true when it comes to investing. In fact, many times the opposite is true when it comes to investing. Of course the sales literature of the largest financial firms will beg to differ, and the allure of paying for more expensive investment products to get better performance will attract some. Regrettably most investors will not experience this outperformance, but they are guaranteed to experience paying more. The large financial firms that create and sell investment products have created mutual funds, which have by and large been a great benefit to individual investors. A mutual fund at the most basic level is a basket that is created to hold securities. By doing this, it provides diversification to investors by allowing people to buy a basket of securities at one time and removing the risk of owning individual securities (see risk of owning individual securities here). So far so good. Until we dig a bit deeper and get into what can be called the mutual fund share class zoo. These same companies who create these mutual funds, create different share classes that can be sold to different investors. The various share classes are broken down the following way: class A, class B, class C, class I, etc., basically a zoo of letters. These various share classes hold the exact same securities in their basket, so there is no difference in terms of holdings, expected return, and risk. The only difference between these various shares classes is how much money is charged and how much the company and it's advisors are going to make. The equation is simple, the more you pay the less you make and the more your advisor makes. It is essential to consider which class of mutual fund shares is suitable for you. I'll let you in on a secret, shhh, all else being equal, buy the lowest cost option. Below is a chart of the Goldman Sachs Technology Fund and all of it's various share class options. Again, the various mutual funds all hold exactly the same securities, the only difference is the amount of money being charged to own this fund. It's a dramatic difference between the lowest cost share class fund and the highest cost fund. $100,000 invested 10-years ago would be worth anywhere between $542,000 and $484,000. This $58,000 dollar difference is solely due to which shares class your advisor used. Costs matter. Conflicts of Interest Matter. Sadly most financial advisors don't have to use the lowest cost option as these financial advisors will make more money if they use the more expensive option. Yuk. 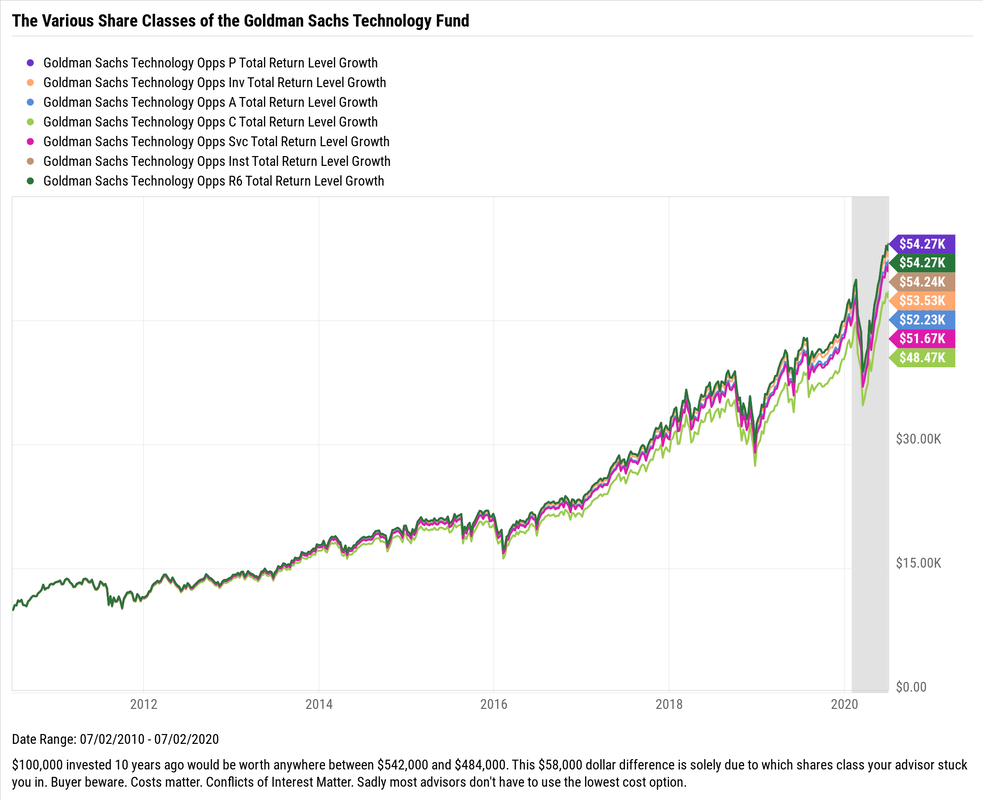 Or if you really want to save money with essentially the same holdings and with historically better performance, the iShares Technology fund (IGM) is an option - see the purple line below. In fact, it's dramatically outperformed all of the Goldman Sachs Technology funds. Of course, past performance is no guarantee of future returns. 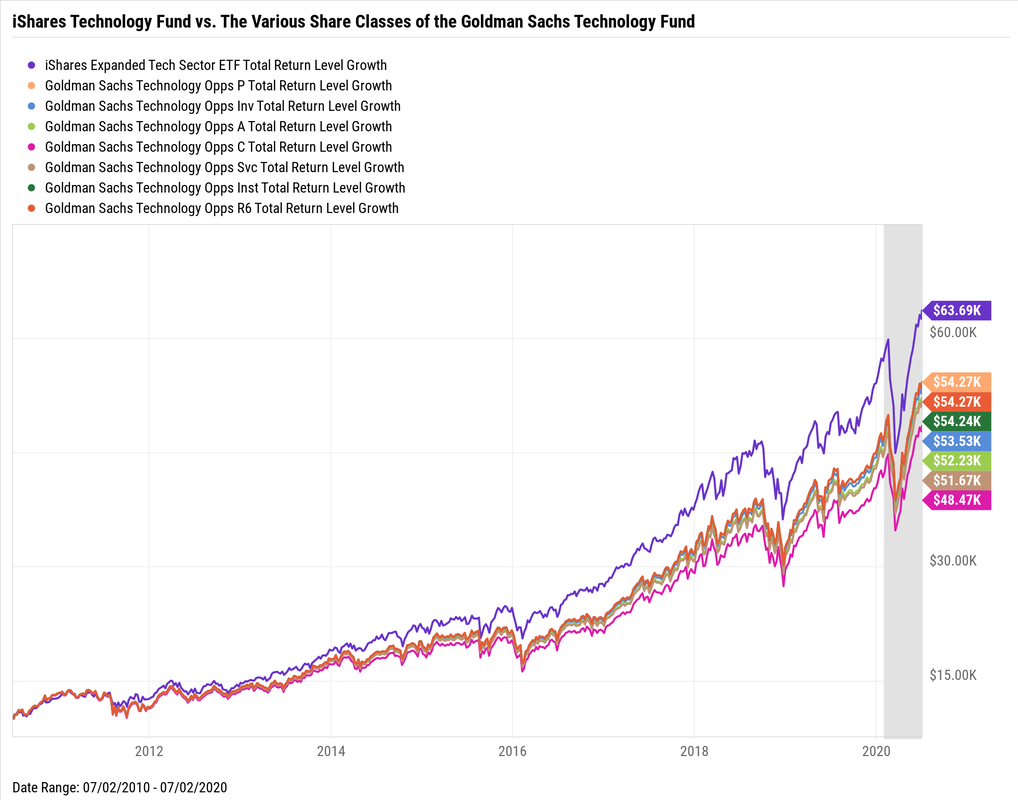 While the technology sector has performed extremely well recently, I use this just as an example of the share classes (and the affect costs have on peformance) many of the large financial firms use and not necessarily promoting technology focused investments right now.
The example above used Goldman Sachs, but this holds true for all the other large financial firms: Morgan Stanley, Wells Fargo, JPMorgan, and Merrill Lynch (Bank of America), just to name a few. They are all guilty of promoting more expensive funds to investors who may not be aware of all the mutual fund share classes. Be careful, It's a zoo out there. |