|
The stock market has continued its historic rally with the S&P 500 gaining 14+% year-to-date, contributing to a total return of 55%+ since the market bottom in 2022. While much of this performance has been driven by large cap technology stocks over the past 18 months, there are now signs that other parts of the market are benefiting as well. These shifts highlight the important fact that while investing trends may come and go, it’s the tried-and-true principles of investing that help investors grow their portfolios and achieve their financial goals over years and decades. What should investors know about diversifying across sectors and styles over the next several quarters? Performance is broadening beyond large cap growth While investors tend to focus on major market indices and the one or two areas driving recent returns, the reality is that performance leadership tends to change over time. Large cap tech stocks have dominated headlines recently and for good reason – the Magnificent Seven stocks have gained 180+% over the past year and a half. This is partly due to excitement over artificial intelligence breakthroughs, and partly because lower interest rates are generally positive for growth. This recent performance is also a reversal of the tech crash in 2022 when the Fed hiked rates. However, as the accompanying chart shows, there are now signs that other areas of the market are beginning to participate, with three important implications for investors. First, recent economic reports confirm that inflation is improving which could lead the Fed to cut rates. This has propelled areas such as small cap stocks and large cap value. Small caps in particular tend to be more sensitive to interest rates since they represent less mature companies that often have more limited access to capital. Thus, the prospect of lower rates can be a catalyst for many of these stocks. These companies also tend to be more U.S.-focused, so they often outperform when there is positive news on economic growth. Growth and value can each outperform over long periods What exactly are value and growth stocks? While their exact definitions can differ among investors, these factors tend to be characterized by each stock’s valuation level. Those with lower valuations (P/E, P/S, P/FCF. P/B) tend to be characterized as “value” while those with higher valuations (P/E, P/S, P/FCF, P/B) are classified as “growth.” More broadly, value investors hope that a stock’s share price will adjust based on what it “should” be worth based on fundamentals such as earnings and free cash flow. Growth investors, on the other hand, hope that a company will continue to grow substantially, and are thus less concerned about the current valuation level or share price. The accompanying chart provides historical perspective on how value and growth have fluctuated over time. In the late 1990s and early 2000s, growth stocks outperformed during the dot-com boom. This then gave way to strong outperformance of value stocks through much of the 2000s. This cyclical rotation from growth to value and back has occurred throughout history, driving much of the academic research around the value premium. So, while growth stocks have strongly outperformed most recently, history shows that leadership changes are not unusual.  Diversifying across styles helps to reduce portfolio risk Finally, the outperformance of growth stocks does not mean that diversification is no longer relevant. In fact, the opposite is true: diversifying across styles allows investors to benefit from recent market trends while also protecting their portfolios from potential risks. For example, the accompanying chart shows that those parts of the market that have performed well also have excessive valuations. The price-to-earnings ratio of large cap growth is now 28.4, driving the overall S&P 500 index P/E to 21.2. In contrast, large cap value only has a P/E of 15.7 while small cap value is far less expensive at 13.8. This is the case even though small cap value stocks are expected to experience earnings growth rates similar to large cap growth stocks over the next twelve months.  Performance has broadened across sectors as well. Ten of the eleven S&P 500 sectors have positive returns this year, with only the real estate sector slightly negative. Many sectors have year-to-date gains of 8% or more including financials, utilities, consumer discretionary, industrials, consumer staples, healthcare, and energy. While tech stocks have received most of the attention, and a few individual stocks have significantly outperformed the market, there are signs that other sectors are benefiting from the rally as well.
The bottom line? History shows that long-term investing isn’t just about “predicting winners” – it’s also about diversifying across styles, sectors, and more. Market leadership not only changes over time but also can do so swiftly. Staying diversified allows long-term investors to benefit from opportunities while also having a smoother ride as they work toward their financial goals. -Paul R. Rossi, CFA
0 Comments
A question that investors need to ask themselves today, should I choose a longer-term bond/bond fund when money market funds are yielding more than 5% with no risk (however there is interest rate risk). With money market yields at their highest level in years, it’s not necessarily an easy decision. This perspective has some validity, especially if you expect rates to rise. In that case, money market rates would likely increase while longer maturity fixed income would suffer. However, if you believe the Federal Reserve's indication that rate hikes are unlikely and you expect the next rate move to be lower, then moving into longer duration bonds makes sense. As an example, investing in a money market fund today yields a little over 5% which represents the maximum possible return (assuming no further Fed rate hikes). While you won't lose money, your returns could drop below 5% if the Fed cuts rates. For instance, if rates fall to around 4% in a year, your returns might average 4.5%. A faster or more aggressive rate cut could reduce returns to around 4%. Essentially, 5% is the ceiling, with only potential downside. On the other hand, even a modest 1% rate cut by the Fed can potentially push fixed income returns (like those in the Bloomberg Aggregate Index) to over 10%. And a more significant rate cut (like 2%) could drive total performance to over 16%+. The idea that the next move the Fed initiates is a rate cut, makes a strong case for choosing moderately longer maturity fixed income investments over money market funds.  -Paul R. Rossi, CFA PS. If you want to dig a bit into the mechanics of bond pricing, keep reading. What is the relationship between interest rates and bond prices, and how is it calculated? For those that are a little more math inclined, it’s called Modified Duration, and it measures the price sensitivity of bonds to changes in interest rates. In a nutshell, bond prices and interest rates are inversely related, and the longer the maturity of a bond, the more sensitive the bond is to changes in interest rates.  t = time period
PV(CFt) = present value of the cash flow at time t P = price of the bond YTM = yield to maturity n = number of periods per year (e.g., 2 for semi-annual payments)  As my family gathers to celebrate July 4th, I'd like to honor the spirit of independence that our founding fathers instilled in this great nation. Independence Day is a time for reflection, gratitude, and celebration. It’s a day to commemorate the bravery, vision, and determination of those who fought and continue to fight for the freedoms we enjoy today. The founding fathers, through their foresight and unwavering commitment, laid the foundation for a nation built on the principles of liberty, justice, and the pursuit of happiness. Their vision was not just about breaking free from colonial rule but also about establishing a country where individuals could thrive and achieve their dreams. July 4th is a reminder of the enduring values that make our country strong. It’s a day to appreciate the freedoms we sometimes take for granted – freedom of speech, freedom to pursue our ambitions, and the freedom to shape our own destinies. These are the same freedoms that allow us to dream big and strive for financial independence, securing a prosperous future for ourselves and our families. As we celebrate with fireworks, barbecues, and parades, let's take a moment to reflect on the sacrifices made by those who came before us. Their dedication and hard work laid the groundwork for a nation that thrives on innovation and resilience. It’s this same spirit that drives us to plan for our futures and achieve our goals, ensuring that the legacy of independence lives on. This July 4th, while we enjoy the festivities with our family and friends, I'd like to also remember the importance of unity and community. Just as our founding fathers worked together to build a strong nation, we too can work together to build strong communities and support each other’s journeys towards achieving personal and financial goals. Happy Independence Day! May the spirit of freedom, courage, and resilience continue to guide us all in our pursuit of happiness and prosperity. Here's to the enduring legacy of our great nation and the bright future that lies ahead. -Paul R. Rossi, CFA P.S. Can you find me, my wife Sabrina, and our little guy in the picture from last's year July 4th celebration at Town Center in El Dorado Hills?  Understanding Genuine Market Bubbles vs. the Natural Flow of Market Cycles
The concept of a bubble in asset markets typically involves rapid wealth accumulation followed by a dramatic collapse, resulting in significant financial losses. Trying to understand this phenomenon has captivated investors and economists for decades. The term "bubble" is frequently used in discussions about various markets, the stock market, AI, real estate, or art. But what exactly constitutes a market bubble, and how can investors recognize one? Defining a Market Bubble A market bubble is characterized by a rapid escalation in asset prices to levels significantly higher than their intrinsic value, driven by exuberant market behavior rather than fundamental economic factors. These unsustainable price increases create a false sense of fundamental understanding and FOMO (fear of missing out) takes hold, which leads to further speculative buying. However, eventually (and always) reality sets in, the bubble bursts, and prices plummet causing substantial financial losses. Market Bubbles vs. Market Cycles It is crucial for investors to distinguish between market bubbles and regular market cycles. Market cycles are driven by fundamental economic factors and are a natural aspect of market dynamics. Prices rise and fall in response to changes in economic indicators, corporate earnings, and investor sentiment. These cycles are expected and generally do not result in catastrophic losses. In contrast, a market bubble involves price increases that are unsupported by underlying fundamentals and when a bubble bursts, it results in a sharp decline in prices, often leading to significant and permanent losses for investors.
The Balloon Analogy The term "bubble" might be overused, and a more fitting analogy could be a "balloon." Just as a balloon can expand and contract without bursting, the economic system can and often does manage periods of exuberance, unless they reach extreme levels. Recognizing the difference between a balloon that is simply expanding and one that is on the verge of bursting is key for investors. Current Market Conditions Analyzing the current state of the U.S. equity market reveals that while there may be pockets of overvaluation, the overall market does not exhibit the hallmarks of a bubble. Here are some observations:
Focus on Fundamentals The fear of market bubbles is understandable, given the historical impact they have had just in the last 25 years. However, it is essential for investors to discern between a genuine bubble and the natural ebbs and flows of market cycles. By maintaining a vigilant approach and focusing on fundamental economic indicators, investors can better navigate periods of market exuberance and avoid the pitfalls of true bubbles. While the U.S. equity market currently shows signs of overvaluation in some areas, it does not exhibit the widespread, unsustainable price increases characteristic of a bubble. Thus, a balanced perspective and prudent investment strategy remain crucial for long-term financial success. Investors Should Remain Focused On:
While the market cycles through phases of growth and contraction, recognizing the signs of a true bubble and maintaining a disciplined investment approach can help investors achieve better long-term outcomes. Knowing what you own, why you own it, and how it reacts to various economic shocks is important. -Paul R. Rossi, CFA As with many things in life, knowing what we’re supposed to do and actually doing it are two separate things. This is true for our health, relationships, careers, and of course, our finances. When it comes to investing, it’s well known that having a plan, properly diversifying, and staying invested are the best ways to achieve long-term financial goals. However, this is often easier said than done, especially when market and economic outlooks are uncertain, as they have been for some time. Fortunately, there are investment methods for managing the emotions that come from market volatility. What should investors know about how they can stick to an investment plan through years and decades? The Answer: Dollar-Cost Averaging & Lump Sum Investing  Knowing when and how to invest in the stock market can be challenging, especially if you suddenly come into a large sum of money through an annual bonus, the sale of a business, an inheritance, etc. In the long run, investing properly can turn savings into wealth. In the short run, however, market volatility can derail even the most steadfast investors. This is where dollar-cost averaging can help. With dollar-cost averaging, investors regularly invest a set amount on a pre-planned schedule. This reduces the temptation to follow and react to every market move or to try to time the market. If you already make regular, automatic contributions to your portfolio with each paycheck, such as through a 401(k) plan at work, you are technically already using dollar-cost averaging. Whether these investments occur monthly, quarterly, or annually turns out to matter much less than simply sticking to a plan. The opposite, investing all at once, is often known as lump sum investing. How your portfolio performs in the short run is very much determined by how the market performs immediately after the investment. This can be seen in the chart above (first page) which shows the hypothetical returns between these two methods beginning in 2000. Investing $100,000 in the S&P 500 would have lost value almost immediately due to the dot-com crash. This would have recovered over the next several years until the housing crash. Finally, the value of this investment would have recovered in 2013 when the S&P 500 returned to all-time highs and then benefited from the long bull market that followed. This chart also shows the hypothetical returns of a dollar-cost averaging approach in which the investor splits up the $100,000 into monthly investments over this full period. This is a rather extreme example given the length of the time period, but it serves to highlight some key facts. Dollar-cost averaging on a monthly schedule would have avoided the market drawdowns early in the period when the portfolio would have mostly been held in cash, remaining relatively flat through the mid-2010s. There is an inflection after this when the lump sum portfolio catches up and outperforms due to the strong bull market. So, both methods had their benefits and time to shine over the past two-and-a-half decades. Dollar-cost averaging can make it psychologically easier to invest The takeaway here is less about how to maximize returns than how to stay invested through years and decades. Dollar-cost averaging can help reduce risk in situations where markets fall sharply, especially early on. However, lump sum investing tends to outperform dollar-cost averaging in the long run since, historically, markets have steadily risen over time. This is analogous to comparing a 100% stock portfolio to a properly diversified one that holds a balanced mix of stocks, bonds, cash, and other asset classes. The 100% stock portfolio might outperform over long periods, especially during strong bull markets like todays, but it will also experience sharper and more painful pullbacks. A well-designed and diversified portfolio, on the other hand, will experience steadier growth and more muted declines, making it easier for investors to stay levelheaded. This is especially relevant today with the market near all-time highs. The truth of the matter is that markets are always uncertain. Whether it’s the upcoming presidential election, geopolitical conflict, or the direction of interest rates and the economy, investors may worry that the market could pull back just after they invest.  It’s important to keep in mind that just because the market is near a current peak doesn’t necessarily mean it’s “due for a pullback.” By definition, markets achieve many new all-time highs as they rise during bull markets. While there has been significant uncertainty this year due to interest rates, inflation, and the Fed, the S&P 500 has already experienced 24 new all-time highs. This includes a sharp rally in May after a slump in April. Ironically, it can be psychologically difficult to invest both when the market is rising and when it is falling, for fear that the market might be at its peak in the first case, and that it might fall further in the second. So, whether dollar-cost averaging or lump sum investing makes more sense depends on the individual investor, their ability to handle risk, and their time horizon. Having a plan to get invested is better than trying to predict the unknowable future. Just as a diversified portfolio can help reduce overall risk and volatility, so can dollar-cost averaging when it comes to investing over time. Dollar-cost averaging may not be the mathematically optimal way to invest, since lump sum investing has tended to outperform over history. However, it can help investors to stay focused on the long run without worrying about every market event or trying to time the market perfectly. The Bottom Line: Dollar-Cost Averaging and Lump-Sum Investing are both ways to start getting invested. History shows that getting invested sooner and staying invested is the most important way to achieve long-term financial goals. -Paul R. Rossi, CFA The ability to anticipate market movements can significantly enhance investment strategies, and portfolio outcomes. Central to this ability is a profound understanding of economic indicators, which provide invaluable insights into the health and direction of the economy. These metrics enable investors to make informed, strategic decisions. Let's explore the importance of economic indicators, identify key metrics to monitor to enhance your analytical capabilities. Defining Economic Indicators Economic indicators are statistical metrics used to gauge the overall health of the economy. They offer critical insights into various economic activities, enabling investors to better predict future market trends. These indicators are essential in financial analysis because they provide data-driven evidence of economic performance and influencing investment decisions. 3 Types of Economic Indicators Economic indicators are broadly categorized into three types: leading, lagging, and coincident indicators. Understanding these categories is crucial for interpreting their relationship to market trends.
Key Economic Indicators for Market Analysis With an overwhelming number of economic indicators available, identifying the most impactful ones can be challenging. Here, we focus on some of the most critical indicators that investors should understand and monitor.
 Economic indicators are essential tools for financial professionals and investors, providing insights that drive strategic decision-making and enhance investment outcomes. By understanding and monitoring key economic metrics, integrating them into portfolio management strategies, and leveraging predictive analytics and AI, investors can better navigate market complexities and deliver superior results.
-Paul R. Rossi, CFA  The financial media tend to focus on macroeconomic concerns:
While these topics are important, history shows that the economy and markets grow over long periods of time due to technological innovation and gains in productivity. It’s for this reason that recent developments in artificial intelligence have captured the attention of investors and economists. They have also led to disagreements about the short-term investment opportunities across technology stocks and, more importantly, about the long-term effects on the economy, productivity and the labor market. What impact do new technologies tend to have on markets and investor portfolios?  It’s understandable that investors often focus on the financing side of markets and the economy, including topics such as interest rates and Fed policy. Projects in the real world need funding so the purpose of the financial system is to direct capital toward its highest-value use. In doing so, investors hope to generate positive returns that grow their capital and be deployed to new activities. The key, however, is for these investments and their returns to correspond to true innovation. As the accompanying chart shows, the past century has been one of unceasing technological advancement from the first assembly lines to putting a man on the moon, to the entire world being connected on a single information network. In fact, the modern era is driven by the idea that technology should improve every year, whether it’s our cell phones, computers, cars or thermostats. In turn, the services they enable should also improve the quality of our lives, including ordering food delivery, watching movies on demand, communicating with friends and family, better medical care, and making investment decisions. Of course, this does not always play out as expected, such as with concerns over social media. What makes the information age unlike previous periods in history? Unlike physical objects such as buildings, machines on factory floors, or hardcover books, one person's use of a digital service doesn't prevent another from using it. This is important because digital tools allow knowledge workers to be more productive in a scalable way, creating benefits across a variety of industries, so even small gains in productivity can compound over time. These are all reasons why many believe that AI is the pinnacle of the information age. Today's optimism on AI stems from the idea that it could enable even more technological innovations and accelerate productivity further. So far, examples of AI-boosted productivity in the business world have mainly been in the form of generating content, automating tasks, and analyzing data. It's hard to predict exactly what impact AI will eventually have, partly due to the pace of advancement, and partly because the impact of new technologies is simply hard to imagine. What's clear from the chart above is that the stock market did not move up in a straight line with past innovations, and many of their effects took years to materialize. As computer scientist Roy Amara said, "investors tend to overestimate the impact of technology in the short-term and underestimate the effect in the long run." There are many examples of this throughout history, most recently with the dot-com boom and bust. In the late 1990s and early 2000s, many companies rushed to add .com and .net to their names, capitalizing on the demand for all things internet related. This also occurred during the “Tronics Boom” of the early 1960s when a wave of companies with that suffix in their names benefited from investor exuberance for the consumer and business adoption of electronics.
While these trends generated significant returns for many years, the bubbles eventually burst. In hindsight, investor capital was clearly not put to its best use despite the promises of outsized returns. The challenge is knowing if there is a bubble to begin with. Today, some are rebranding themselves as AI companies, updating their websites, and using .ai domain names - no different than in the 1990s and 1960s. The performance of large cap stocks has been driven by a handful of companies related to technology and AI, including the Magnificent 7. Companies like Nvidia, for instance, have become household names when only a couple years ago they were primarily known for video game graphics cards. There are clear differences between today's market and the dot-com bubble, the most important being that many large cap companies benefiting from these trends are highly profitable. There is also nothing wrong with taking advantage of a market trend or long-term investment theme. However, history shows that the problem occurs when trying to either time the market or making concentrated bets that are inappropriate for a particular investor's portfolio. Innovation supports market and economic growth over time. Having a short-term perspective is also problematic because the benefits of past technological innovations were much broader than a few stocks over a year or two. For instance, the benefit of the information technology revolution driven by the rise of personal computers and the growth of internet adoption was not, in hindsight, just concentrated in a few dot-com stocks in the 1990s. Instead, the benefits were broad across industries as all companies adopted new technologies that improved their productivity. In fact, the true impact of these technologies took decades to come to fruition and are still affecting markets today. Why is productivity so important? In short, productivity allows us to do more with less. This can be difficult to measure and may not always show up in the macroeconomic data the way we expected. When the personal computer and the internet were developed, productivity was relatively stagnant. In the 1980s, the average year-over-year productivity gain was just 1.5%; lower than the previous three decades. Economist Robert Solow called this the "productivity paradox," saying in 1987, “you can see the computer age everywhere but in the productivity statistics.” Productivity growth finally began accelerating in the early 1990s and remained strong into the early 2000s. This occurred alongside fundamental changes in how businesses delivered products and services. It is difficult to predict how quickly this might occur with AI and how it will transform industries and societies - which is why such predictions are controversial among AI scientists and economists. In a recent paper, MIT economist Daron Acemoglu argues that AI will have its biggest impact if it results in new, higher-value tasks for workers, but that these benefits are not forgone conclusions nor are they likely to be on the scale that some predict. While recent advancements are impressive, it could take time for AI applications to enhance the productivity of workers. On the one hand, it's possible that we are on the cusp of artificial general intelligence (AGI) - technology that could replace human workers altogether. On the other hand, it's possible that AI will require the right applications and adoption to be valuable. In the meantime, the market will try to gauge what value to place on these possibilities in the stock market. It's important for long-term investors to maintain a broader perspective and not get caught up in the day-to-day hype. The bottom line? It's important to be properly invested: Which means being invested for the tailwind called technological innovation. By doing so, investors will benefit from recent trends around AI, technology, and overall increases in productivity, which in turn will drive long-term growth. -Paul R. Rossi, CFA  Treasury bills (T-bills) and money market funds (MMF) are now yielding more than the current inflation rate for the first time in almost 20 years. As investors seek safety amidst economic uncertainty, the yield on T-bills has surpassed the rate of inflation, offering a real return on investment (1.983%). While this may seem counterintuitive given historical trends, it underscores the dynamics of today's financial landscape. *Most professionals consider T-bills and MMF's a substitute for cash. Having a meaningful "cash" position is smart in today's current landscape, with yields on T-bills and MMF generating more than the current inflation rate. Cash can provide several benefits and serve as a strategic component of an investor's overall investment strategy. Here are five reasons why investors should consider cash as an important part of a portfolio:
By incorporating cash into their investment strategy, investors can enhance flexibility, reduce portfolio risk, and maintain financial stability, ultimately supporting their long-term financial goals and objectives. If you currently have substantial money in your checking or savings account at your bank, you would be well-served to move this cash into an account where you can hold Treasury bills, or a money market funds. As the saying goes, "Cash is King," or more precisely, "T-bills/MMF's are King," especially in today's rate environment. -Paul R. Rossi, CFA  What is The Mandela Effect? Refers to a phenomenon where a large group of people collectively misremember or recall an event, fact, or detail in a consistent way, despite evidence to the contrary. The term originated from the false memory of many people believing that Nelson Mandela, the former South African president died while imprisoned, when in reality, he was released from prison. Several theories attempt to explain the Mandela Effect, including confabulation (the brain's tendency to create false memories), suggestibility (the influence of external factors on memory formation), and collective consciousness (the idea that shared beliefs can alter reality). Examples Investors may collectively misremember significant economic events or market trends. For instance, some might believe that the financial crisis saw several years of negative returns, when in fact the stock market was actually up in 2007, 2009, 2010, 2011, and 2012. The stock market was only down one year (2008) during the financial crisis. These false memories can influence perceptions of market risk and investment strategies. More recently, during the outbreak of what would become known as Covid-19, many people believe that when the stock market crashed 2020 (when the lock downs began) that the stock market was negative for the entire year, which was not the case. In fact, 2020 the stock market was up over 18%. Recollection of News Headlines Individuals may misremember news headlines reported by the media. For instance, some might recall hearing news of a major event that never actually occurred, leading to confusion and potential misinterpretation of truth. These false memories can impact and influence decisions based on inaccurate information. The Mandela Effect serves as a interesting example of the complexities of human cognition and the malleability of memory. -Paul R. Rossi, CFA  The annual Berkshire Hathaway shareholder meeting is being held tomorrow; and it will be the first meeting without its long-time Vice-Chairman Charlie Munger, who has sat up at the table with Warren Buffett for decades. It's expected, a good part of the meeting will be a celebration and a tribute to Munger's invaluable contributions to not only Berkshire Hathaway, but also his sage advice over the years to investors and people the world over. Here are some notable quotes of Charlie Munger and Warren Buffett: Charlie Munger
Warren Buffett
Joint Quotes
These dozen quotes encapsulate so much. -Paul R. Rossi, CFA 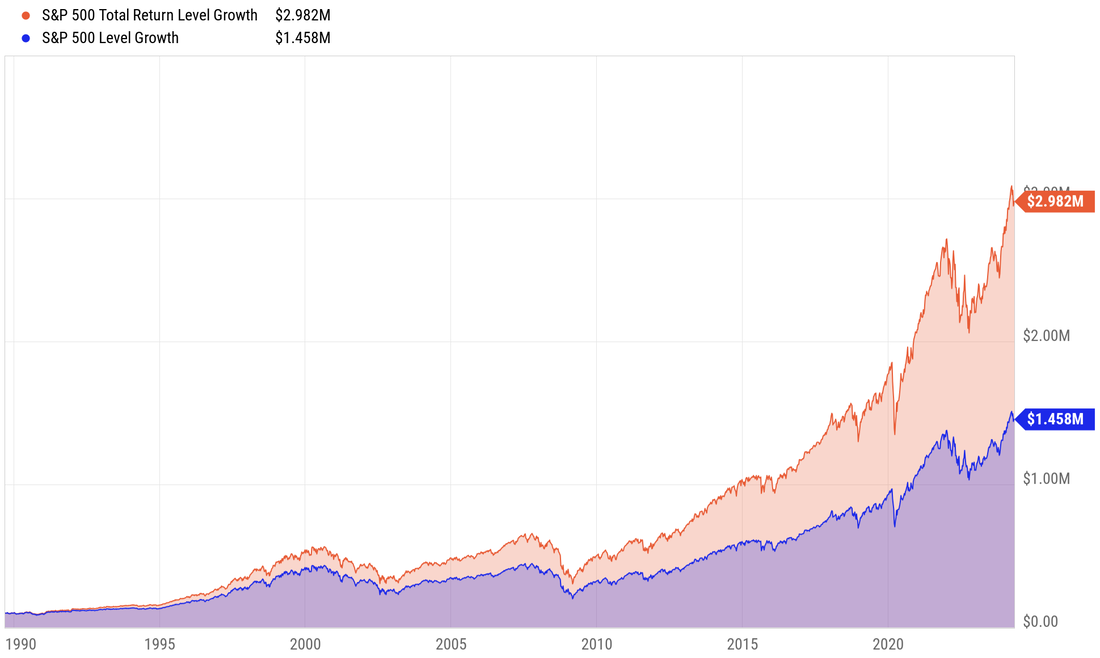 Like a Hollywood scarlet who gets all the attention on the red carpet, the stock market commentators are incessantly talking about the current price of the stock market. Interestingly enough, the power of the stock market isn't where the price is on any given day, the secret is where most people aren't looking. And the chart above, proves it. Stock market price returns and total returns offer distinct perspectives on investment performance. Price return measures the change in the price over time, reflecting capital gains or losses. On the other hand, total return encompasses both price changes and any income generated, such as dividends or interest, providing a more comprehensive view of investment profitability. Over the years, the stock market's price returns have captured attention, especially during periods of rapid growth or decline. Investors often focus on price movements to gauge the market's momentum and make trading decisions. However, solely relying on price return overlooks the significant contribution of income generated from dividends. Over the last 34 years (chart above), an initial $100k portfolio that incorporates dividends (total return - orange line) has grown to more than double what a price return (purple line) portfolio grew to. In two words, Dividends Matter. Total return, incorporating dividends and other income, provides a more accurate representation of an investment's overall performance. It reflects the wealth accumulated from both price appreciation and reinvested income, offering a clearer picture of long-term investment success. The only difference between the orange line and purple line in the chart above, is the power of reinvesting dividends over time. While price returns offer valuable insights into short-term market movements, total returns provide a comprehensive view of investment performance, considering both capital gains and income generation. Investors seeking to build wealth over the long-term should prioritize understanding and optimizing total returns to achieve their financial objectives. -Paul R. Rossi, CFA  U.S. Bureau of Labor Statistics just dropped a number that unfortunately showed the Consumer Price Index (CPI) over the past 12 months had risen by 3.5%. This uptick (from January) wasn't solely attributed to the usual suspects; while gasoline and shelter took center stage, it was the silent yet significant rise in the "food away from home" index. Inflation, that ubiquitous economic phenomenon, paints a complex picture of price fluctuations both locally and globally. From the bustling streets of New York City to the tranquil countryside of rural America, the effects of inflation ripple through the economy, leaving their mark on consumer goods, including one of the most iconic fast-food items of all time: the Big Mac. The Big Mac, McDonalds well known burger, made with two beef patties, tangy special sauce, lettuce, and cheese, sandwiched between two sesame seed buns, can serve as a barometer of inflationary pressures both in the United States and around the globe. The brainchild of The Economist magazine, the Big Mac Index has transcended its fast-food origins to become a symbol of economic analysis, providing a unique lens through which to view inflation and Purchasing Power Parity (PPP) across diverse countries and currencies. What is PPP? At the bottom of this article, I've written 4 short sentences that gives a basic idea of what PPP is. The Big Mac Index not only serves as a distinctive method for assessing inflation, but also for understanding Purchasing Power Parity across diverse countries and currencies. Its premise is fairly straightforward: while the Big Mac sold at McDonald's remains uniform globally, its price in each country mirrors local factors like ingredient costs, wages, and advertising expenses. Consequently, despite the identical product, the price of a Big Mac varies from one nation to another. Frequently utilized for approximating the relative strength of foreign exchange rates, the Big Mac index is a reflection of a country's inflationary pressures. Inflation Comparison: To see how the change in the price of the Big Mac and the change in the CPI are related, The Economist calculated recent annual inflation rates, which they call Big Mac inflation and CPI inflation, respectively. The Big Mac cost 45 cents when it first appeared in 1967. Today, it costs more than 10 times the original 45 cents in 20 states, growing a bit faster than the overall inflation rate. To determine how much customers are paying for a Big Mac across the country, CashNetUSA reviewed Big Mac prices in all 50 states. The study found that the average price of a Big Mac in the United States is a little bit over $5. However, this average belies the contrasts that exist within the US, for example, in Hawaii, where customers fork out $5.31 for a Big Mac, while in Mississippi, it can be had for $3.91. The reasons behind these discrepancies are as varied as the toppings on a Big Mac. Factors such as the cost of ingredients, rent, labor, and local taxes all play a role in determining the final price of this quintessential fast-food item. The story of the Big Mac is more than just a tale of two all-beef patties, it's a reflection of the sophisticated dance between inflation, labor, taxes, PPP, and economic forces at home and abroad. As we navigate the ever-changing landscape of the global economy, the humble Big Mac can be the harbinger of economic trends. In a world of volatility, the Big Mac's flavor and its’ secret sauce is a constant. -Paul R. Rossi, CFA Side comment: While I don't eat a lot of Big Mac's, periodically I do...although I'm not sure I've ever seen my Big Mac look like the one pictured above. :) Purchasing Power Parity (PPP): Is an economic theory which illustrates how exchange rates should adjust so that identical goods cost the same in different countries. For example, if a Big Mac costs $5 in the U.S. and €4 in Europe, PPP implies that the exchange rate should be such that 1 US dollar equals 0.8 euros. If the dollar buys more euros, it's overvalued; if it buys fewer, it's undervalued. Understanding PPP helps us grasp why prices may differ when we travel and why exchange rates matter. By comparing currencies to PPP, economists assess whether they are overvalued or undervalued, aiding in international trade and economic analysis.  Investing in some of the most successful companies isn't just about owning shares; it's about having some of the brightest minds in the world work for you. When you buy stock in a company, you're essentially investing in the talent, innovation, and expertise of their employees and leadership teams. Want to hire Elon Musk? If you own shares of Tesla, you're not just betting on electric vehicles; you're betting on Elon Musk's vision for the future of transportation and sustainable energy. Tesla employs some of the smartest engineers, designers, and researchers who are constantly pushing the boundaries of technology, from developing cutting-edge battery technology to pioneering autonomous driving systems. By investing in Tesla, you're tapping into their collective genius and benefiting from their relentless pursuit of innovation. Similarly, owning shares of Apple means you're backing one of the most innovative companies in the world. Apple's success is built on a foundation of groundbreaking products, iconic design, and a relentless focus on customer experience. From the visionary leadership of Steve Jobs to the current leadership under Tim Cook, Apple's employees are driven by a passion for excellence and a commitment to shaping the future of technology. As a shareholder, you're aligning yourself with their mission and sharing in their success. How about hiring Jensen Huang, CEO of NVIDIA. NVIDIA is another prime example of a company that exemplifies innovation and technological advancement. As a leader in graphics processing units (GPUs) and artificial intelligence (AI), NVIDIA's products are at the forefront of industries such as gaming, data centers, and autonomous vehicles. By investing in NVIDIA, you're supporting a company that is driving the next wave of computing revolution, from breakthroughs in graphics rendering to advancements in AI research. Beyond Tesla, Apple, and NVIDIA, investing in other successful businesses offers similar opportunities to harness the intellect and creativity of their teams. Whether it's Amazon revolutionizing e-commerce, Google shaping the future of information technology, or Facebook connecting billions of people worldwide, these companies attract top talent from around the globe and empower them to innovate on a scale that's unparalleled. As an investor, you have the unique vantage point of being part of this journey—to participate in the growth, prosperity, and impact of some of the world's most influential companies. While market fluctuations and economic uncertainties may create short-term volatility, the long-term trajectory of businesses is driven by the talent, ingenuity, and dedication of their employees. By investing in these companies, you're not just buying stock; you're investing in the future and having some of the smartest people in the world work for you. It's nice to be the boss. -Paul R. Rossi, CFA  The Augusta Tax Rule Saves Homeowners and Business Owners Real Money
As The Masters Tournament gets underway this week, it's fitting to highlight a tax strategy that has its origins around this prestigious tournament held annually in Augusta, Georgia. Officially its spelled out in Section 280A(g) of the IRS code, let’s delve into the backstory and details of this tax rule. Origins
What Is the Augusta Rule?
Business Owner Use To leverage the Augusta Rule for tax-free income, consider these steps:
Tax-Free Benefit
The Augusta Rule provides homeowners with a unique opportunity to earn tax-free income by renting out their homes to their businesses. In my mind, the Augusta rule is an eagle. -Paul R. Rossi, CFA 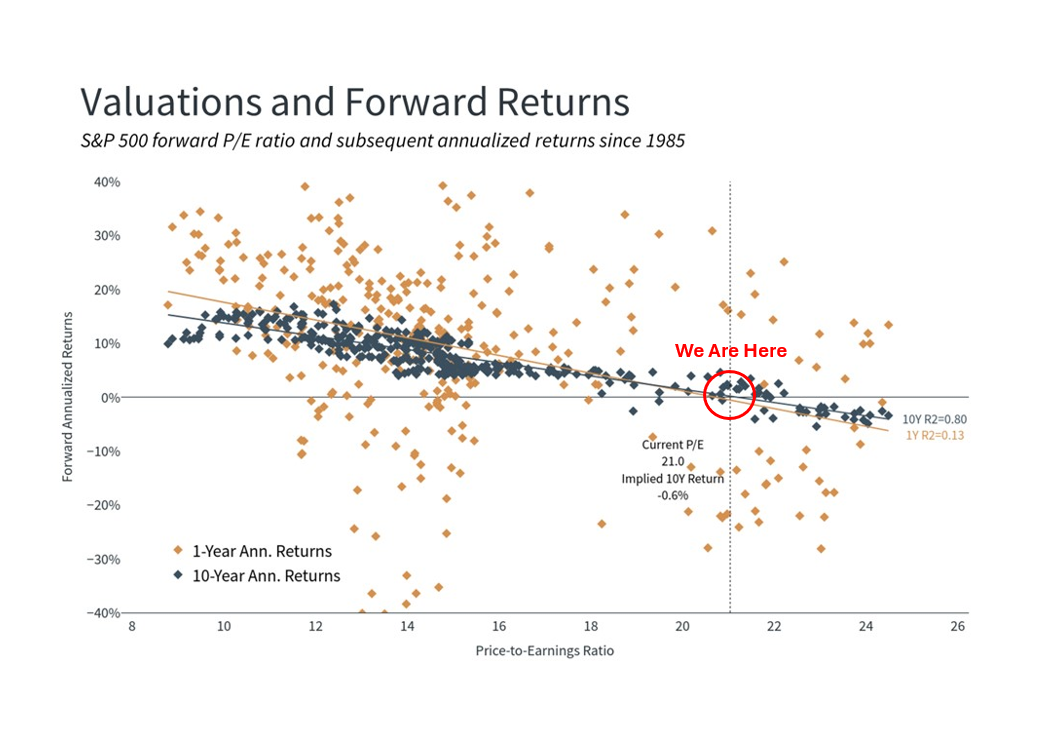 In the dynamic landscape of investing, understanding how stock market returns behave under various conditions is paramount to make informed decisions. One such condition is when the stock market is trading north of a 20 Price-to-Earnings (P/E) ratio. This article delves into what investors can expect in terms of future stock market returns when facing this scenario. The chart above provides some historical information about returns going forward based upon where we are today.
Understanding P/E Ratio The Price-to-Earnings ratio, or P/E ratio, is a fundamental metric used to evaluate the valuation of a company's stock. It is calculated by dividing the current market price of a stock (or index) by its earnings per share (EPS). A high P/E ratio indicates that investors are paying more for each dollar of earnings, suggesting potentially inflated stock prices. Historical Perspective Historical data provides valuable insights into how the stock market behaves when P/E ratios exceed 20. Over the years, periods of elevated P/E ratios have often been followed by lower future returns (chart above). This phenomenon is attributed to the market's tendency to revert to its mean valuation over time. Market Cycles and Investor Sentiment Investor sentiment plays a crucial role in driving stock market valuations. During periods of optimism and bullish sentiment, P/E ratios tend to rise as investors anticipate strong future earnings growth. However, excessively high P/E ratios may signal overvaluation and set the stage for potential market corrections or subdued returns in the future. Impact of Economic Factors Economic conditions and macroeconomic indicators can magnify volatility when P/E ratios are elevated. Factors such as interest rates, inflation, GDP growth, and corporate earnings growth (or lack thereof) all play a significant role in market valuations. Strategies for Investors When faced with a stock market trading above a P/E ratio of 20, investors may consider adopting a cautious approach. Knowing what you own, why you own it, and what actions, if any, will you take should there be a dramatic repricing. If history is any guide, the current market valuation may indicate that future returns will not be as great as they have been over the last 10 years. Understanding the interplay between P/E ratios and future returns is essential for investors seeking to make informed decisions in an ever-evolving market environment. -Paul R. Rossi, CFA 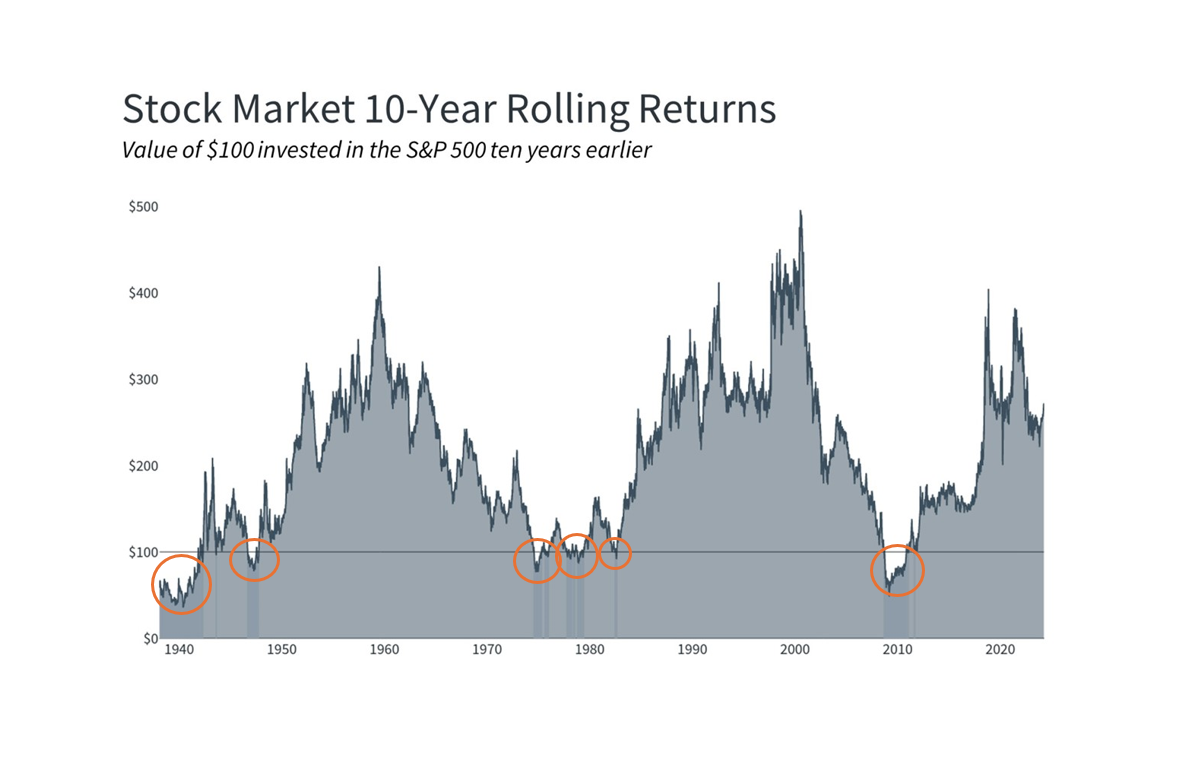 For some, the allure of the stock market lies in its potential for large wealth accumulation. Historical data often showcases the market's upward trajectory over extended periods, fueling optimism and confidence in its ability to deliver riches.
However, amidst the enthusiasm, it's crucial to acknowledge a fundamental truth: the stock market can, and indeed, has lost money even over 10-year periods. While the stock market has historically exhibited an upward trend over the long term, it is not immune to downturns and extended periods of negative returns. Understanding the factors behind such occurrences is essential for investors to manage expectations, mitigate risks, and make informed decisions. One of the primary drivers of stock market losses over several years is the ebb and flow of economic cycles. Economic downturns, recessions, and financial crises can significantly impact stock prices, leading to prolonged periods of negative returns. For example, the dot-com bubble burst in the early 2000s and the global financial crisis of 2008 resulted in substantial losses for investors over multi-year periods. Fear, uncertainty, and panic selling during times of crisis can exacerbate market declines and prolong recovery periods. Moreover, speculative bubbles fueled by irrational exuberance can lead to inflated asset prices followed by sharp corrections, as seen in historical examples like the housing market crash of 2007-2008. Furthermore, structural changes in the economy, technological advancements, geopolitical events, and regulatory shifts can all influence stock market dynamics and contribute to periods of negative returns. Disruptive innovations, shifts in consumer preferences, or geopolitical tensions can disrupt established industries, leading to declines in stock prices for companies caught off guard. It's essential to recognize that the stock market's long-term performance is not a linear upward trajectory but rather a series of peaks and troughs. "Some people can handle it psychologically. If you can't handle it psychologically, then you really shouldn't own stocks, because you're going to buy and sell them at the wrong time." - Warren Buffett There have been many 10-year periods that have generated 300%, 400%, and even 500%+ returns. While historical data may suggest overall growth over extended periods, individual investors may experience losses or stagnant returns during specific intervals. While the stock market has historically delivered positive returns over the long term, investors would be wise to recognize the real possibility of experiencing losses or stagnant performance over 10-year periods. The risk is real. -Paul R. Rossi, CFA 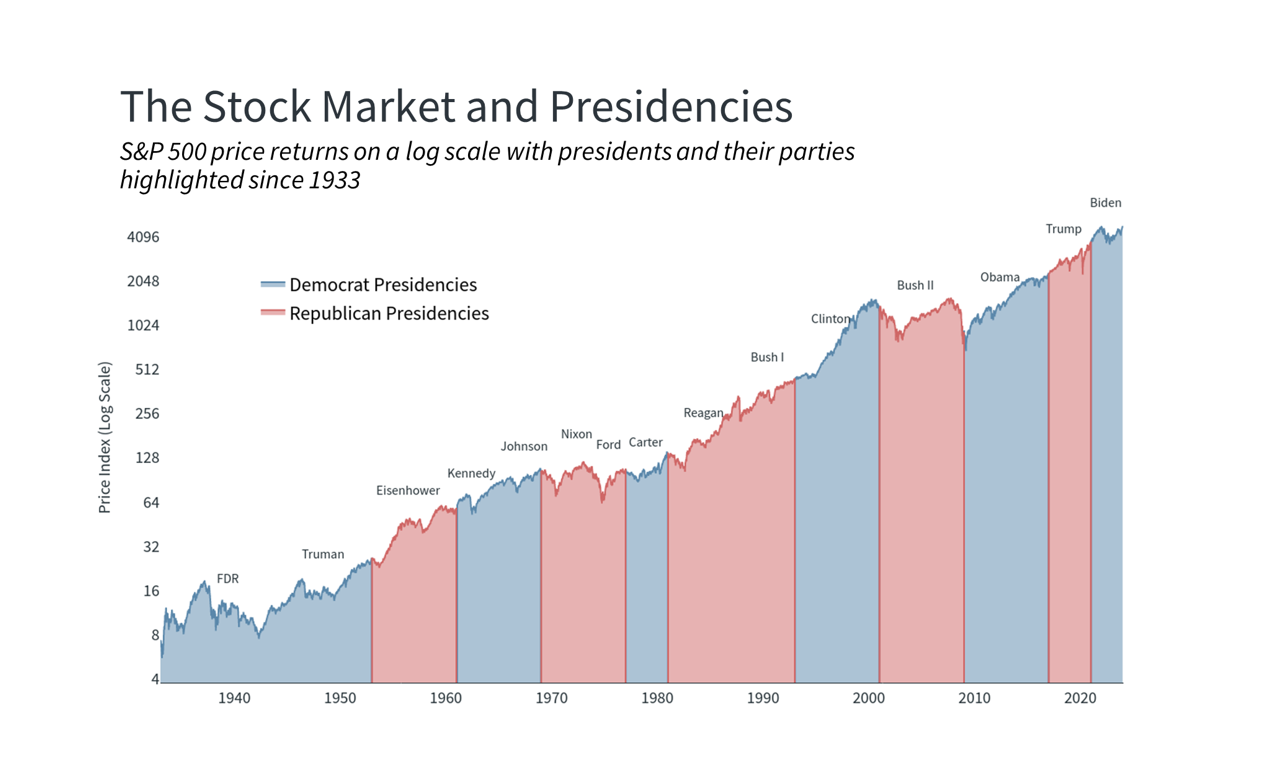 With the presidential election season heating up, there will no doubt be a flurry of daily headlines between now and election day on November 5, although a lot can happen between now and November, it's natural for some investors to be concerned about the impact of politics on the stock market and economy. After all, the political climate has never felt more polarized not just due to elections, but also disagreements in Washington around the budget, immigration, foreign policy, and more. How can investors stay balanced during this year's presidential election? As citizens, taxpayers and voters, elections are extremely important regardless of which side of the aisle you're on and which candidate you support. Your vote helps to determine the principles that will be upheld by the country in the years to come.
However, when it comes to our investments, long-term investors should be wary of claims that one candidate or another will "kill the market" or "ruin the economy." It's likely that this has been said about every president in modern times across 15 presidencies since 1933 (7 republicans and 8 democrats), and was certainly said about Obama, Trump, and Biden. Thus, it's important to separate personal and political feelings from financial plans and investments. The chart above highlights the broad fact that the economy and stock market have performed well across both parties. Focusing too much on who was in the White House would have resulted in poor investment decisions over history, regardless of how strongly one felt. For example, from 2008 through 2020 across the Obama and Trump administrations, the S&P 500 generated a total return of 236%. This occurred despite the vast perceived differences between the parties and the increasing polarization of Washington politics. This also occurred despite many budget battles, fiscal cliffs, debt ceiling crises, U.S. credit rating downgrades, etc., not to mention the global financial crisis, the pandemic, and more. Of course, this is not to say that good policy doesn't matter. Policies on taxes, trade, industrial activity, antitrust, and more can have important impacts on specific industries which can then affect the broader economy. However, not only do policy changes tend to be incremental, but also history shows that it is very difficult to predict how any particular policy might affect the economy and markets, despite conventional wisdom about each party. Stock prices account for new policies quickly and companies and industries tend to adjust and adapt. The business cycle matters much more than who is in the White House. This is why for most long-term investors, it makes more sense to focus on fundamentals such as those related to the business cycle, rather than day-to-day election coverage. On a short-term basis, election headlines have the power to move markets and create stock market volatility. However, these moves are eclipsed by the long-term gains created by market and business cycles. This is perhaps best illustrated by the 1990s and early 2000s. Bill Clinton's two terms happened to be timed perfectly with the information technology boom while the ensuing dotcom bust coincided with the start of the George W. Bush presidency. Unfortunately, the 2008 financial crisis also occurred at the tail end of George W. Bush's second term, resulting in his presidency encompassing both market crashes. Despite this, it would be a stretch to argue that their presidencies were the reason for these booms and busts. While policies influenced these events, they had much more to do with technological and financial innovations. These and other historical episodes suggest that presidents often receive too much blame and credit for economic conditions. Stock market returns are positive on average across both parties. History tells us that market returns are positive on average during election and non-election years alike. While the past is no guarantee of the future, and returns in any individual year are unpredictable, jumping out of the market due to the outcome of an election, or simply because an election is occurring, is not a decision supported by history. The bottom line? History tells us the best course of action for long-term investors is to not make investment decisions based on political preferences. -Paul R. Rossi, CFA Consumer spending is the backbone of the U.S. economy, constituting over two-thirds of our nearly $28 trillion GDP. When consumers spend money on everyday goods and services, and make large one-time purchases, it not only helps to spur economic growth but is also a reflection of economic trends. This is because many factors affect consumer purchases, things like:
Many factors play a role in consumer behavior which affects the economy and in turn influence the stock market, bond market, commodities market, real estate market, and others. What do investors need to know about the state of the consumer and how it might affect the economy and stock market in the coming year? 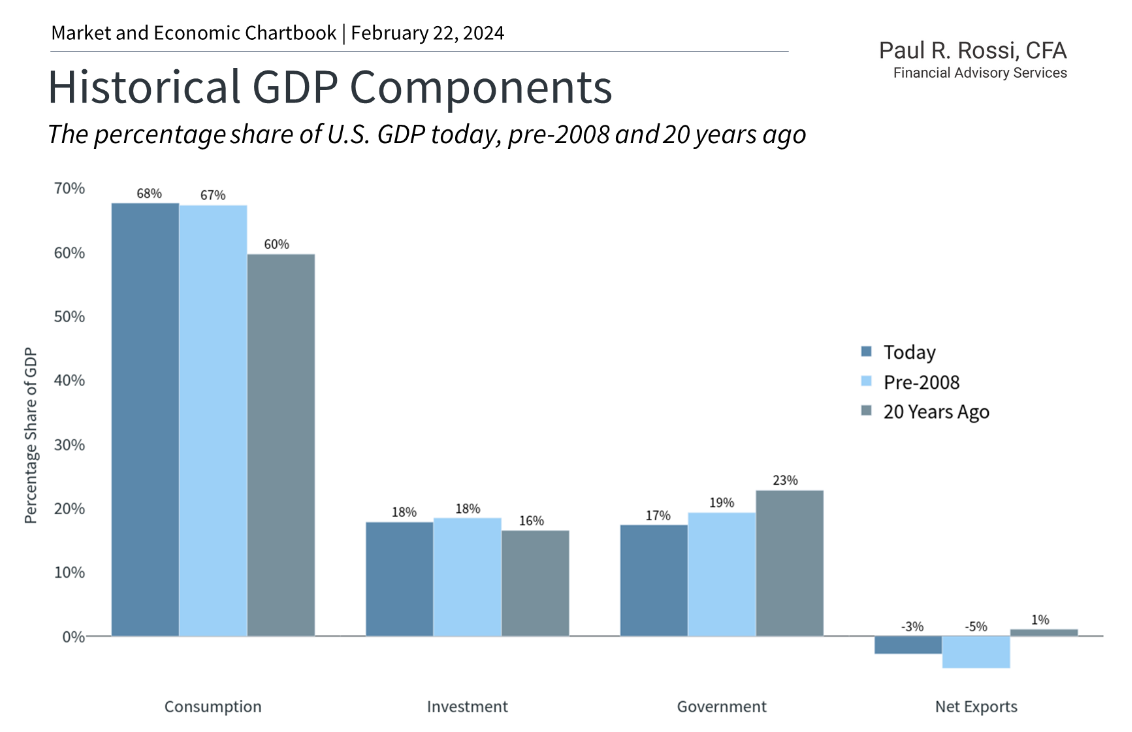 Of the various components of GDP, (click here for a in depth breakdown of GDP) consumer spending has been the most stable and in fact growing, while over the past decade government spending is down. The strength of the consumer has helped the economy stay out of recession despite higher inflation rates, layoffs in the tech sector, and ongoing uncertainty. In turn, this has helped to propel the stock market to new all-time highs. While consumer spending has a direct impact on economic growth, how everyday consumers feel about the economy can vary dramatically over time. Perhaps the best example is the decade following the 2008 global financial crisis. Consumer sentiment was poor for many years due to a weak job market. The housing bust and a sharp decline in manufacturing activity led many to give up on finding work, resulting in a falling labor force participation rate. Even when the overall economy was recovering, consumers were pessimistic. The fact that housing prices collapsed, and it took the stock market almost 6 years to recover also led to lower consumer confidence. In many ways, the situation today is the opposite of the post-2008 period. Despite fears of economic weakness, the unemployment rate is still at a historically low 3.7%, 353,000 jobs were added in January, wages have risen over 4% during the past year, and there are still nine million job openings across the country. The fact that the stock market is near all-time highs has also helped to boost the "wealth effect" among consumers. While the housing market still faces many challenges with 30-year mortgage rates above 6%, transactions that do occur are closing at relatively high prices. What's the bottom line? Despite some headwinds, consumers are increasingly optimistic as inflation improves and the job market remains strong. While there are still challenges ahead, consumer spending continues to support the economy and the stock market. The bottom line is the consumer will determine our path forward. -Paul R. Rossi, CFA  Back in 2020 I wrote an article titled, "How to Leave a $1 Million Legacy to Your Children or Grandchildren with Only $10,000." How about we improve upon this outcome by several million dollars? I can’t remember the last time I thanked our Congress, but after coming up with a novel idea to the new rules around the Secure Act 2.0, maybe we all should. There is now a tangential approach that can feed into our original strategy. First, let’s point out the original strategy is a powerful tool for parents and grandparents to help set up the next generation. This new idea is one that can be layered on top of the original game plan that can dramatically improve the outcome. Let’s quickly recap what the original article laid out: The approach calls for setting up a custodial Roth IRA Account for your child/grandchild. The idea is to contribute $10,000 into a custodial Roth account by the time they are 18 which, when properly invested, it could grow to just over a $1M over the course of their lifetime. And when the money is taken out during retirement, they pay zero taxes on the million-dollar gain. (Link to original article here). There is one caveat to this strategy, the child/grandchild must have what the IRS considers “earned income” to be able to contribute to any type of retirement account. And as such, the account cannot be opened and funded until they are of working age. Still a great plan but doesn't allow tax-free investing until they are of working age. Even with this caveat, it allows the possibility of turning $10,000 into $1,000,000. Now let’s improve upon it. This is where the new strategy comes in and complements the original. The Secure Act 2.0 that was recently passed by Congress is the vehicle to do the early lifting. It now allows up to $35,000 to be rolled over from a 529 (education investment account) into a Roth account. So, what this new law does, it now allows you to get funds invested much earlier, and therefore there is more time for the money to grow. Here are the simple steps:
*An additional benefit: Gifted money from family and friends can now be turned into retirement savings. Doing some ‘time value of money’ calculations with this earlier starting point now allows the portfolio to grow to over $4 million dollars. Using the Secure Act 2.0 now improves the original outcome from $1 million to $4 million dollars. -Paul R. Rossi, CFA *Keep in mind there are additional details that investors/parents/grandparents need to understand before implementing this or other strategies. 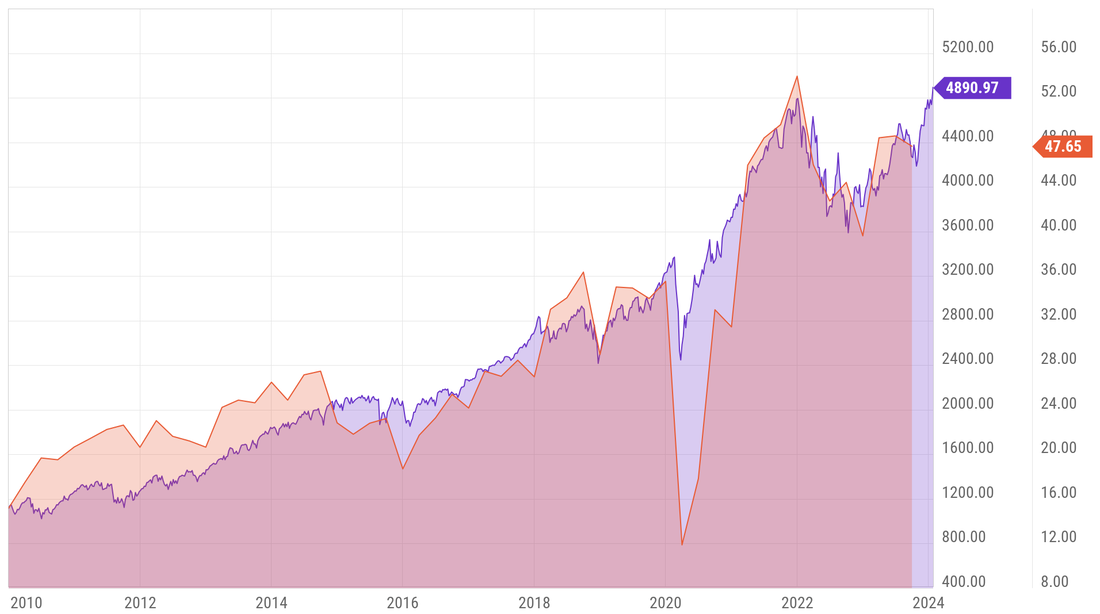 If there is one relationship to understand, this is it.
Yes, there are other factors that impact the stock market, things like interest rates, growth rates, current valuations, investor sentiment, and political events, just to name a few...but the growth in corporate earnings is THE #1 driver of stock market returns over time. Period. -Paul R. Rossi, CFA 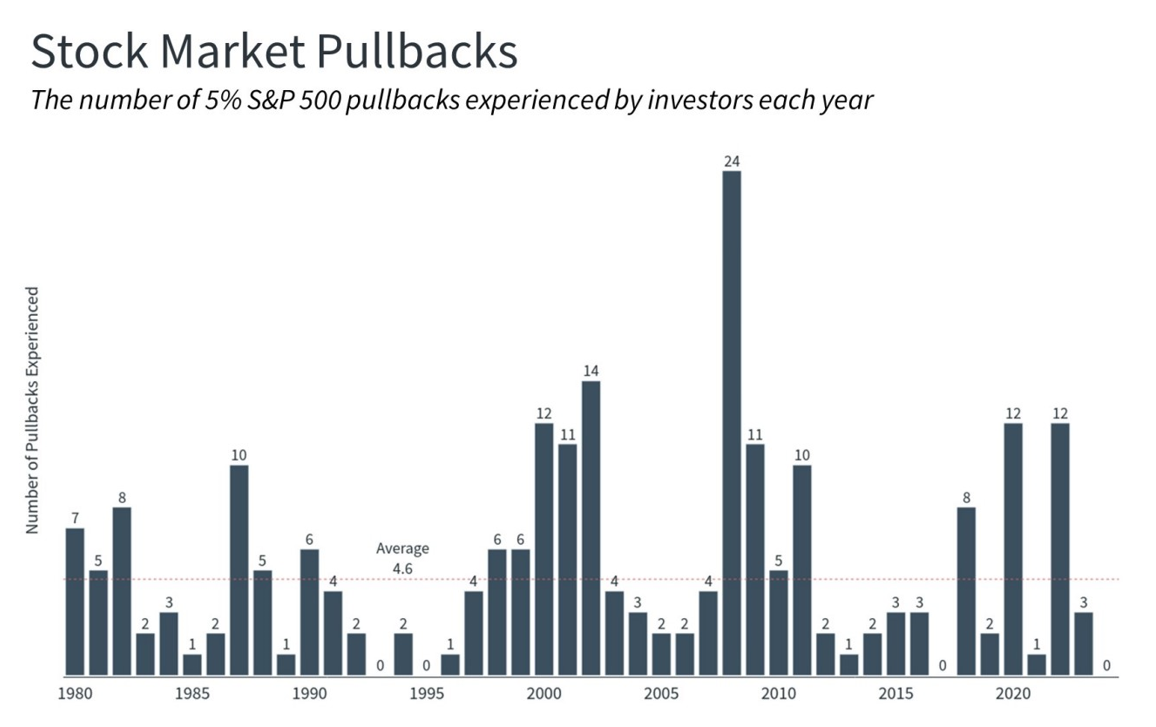 Very few things in life move in a perfectly linear manor.
The stock market is no different. Think of it as a feature of the system and not a bug, it can't be completely squashed. This chart above shows the number of pullbacks in the S&P 500 price index going back to 1980. There have been 226 pullbacks, and in this case, a pullback is defined as a drop greater than or equal to 5% from a previous high. You'll notice, they are quite common. Investing in the stock market is inherently uncertain in the short-term. Large and small pullbacks can occur at any time...and do, quite regularly. The market experiences several pullbacks each year with very few exceptions. Understanding and accepting this truth will go a long way in helping you build wealth. So, what's my prediction for 2024? I'll step out on a limb, and say, "the market will be volatile." -Paul R. Rossi, CFA 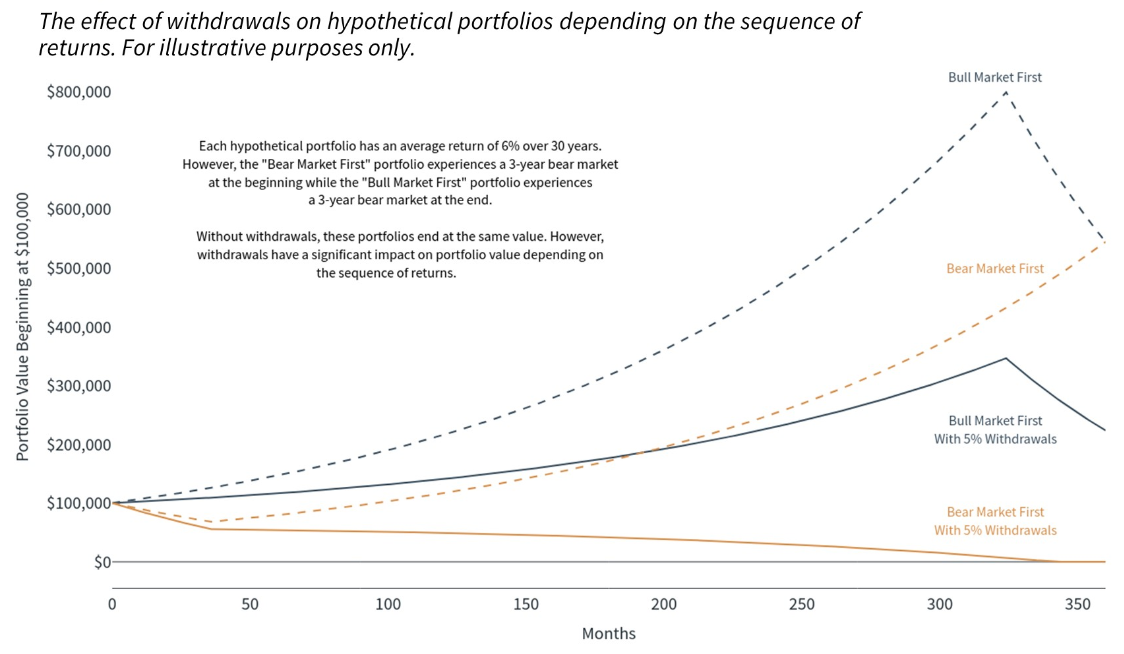 Little talked about, but this idea has major implications for retirees. Two portfolios (the two top dashed lines in the chart above) with the same returns, not surprisingly, will without end up at the exact same point despite the sequence of their returns being different. Meaning, it doesn’t matter in which order the returns happen as long as the returns are the same overall. However, the portfolios (the two solid lines) with fixed withdrawal rates end the 30-year period at vastly different points based on when market drawdowns occur. When taking distributions, timing matters. A sound financial plan and asset allocation when approaching and entering retirement can help to mitigate what’s called “Sequence of Returns Risk." -Paul R. Rossi, CFA Guest post by: Abby Holt of [email protected] Like it or not, money has a big influence on our life's success. Our financial beliefs, emotions, and habits play a significant role in shaping our financial future. By understanding and addressing our money values and behaviors, we can make more informed financial decisions and cultivate a positive relationship with money. Unveil and Overcome Your Financial Fears We all have certain limiting beliefs about money that can potentially hinder our financial growth. It's time to confront these fears, question their validity, and replace them with empowering beliefs about your ability to achieve financial prosperity. By challenging these beliefs and embracing a positive mindset, you open yourself up to new opportunities and possibilities. Take control of your financial future and create the abundance you deserve. Give Yourself an Edge with an Online Degree These days, the competition in the business world is fierce – so if you’re thinking about changing careers or starting your own business, earning an online degree is a great place to start. For instance, one potential option is pursuing a degree in computer science, you'll gain vital skills in logic, architecture and systems, data structures, AI, and computer theory, which can make you an in-demand professional. Also, online degree programs make it easy to work full-time and keep up with your studies. Empower Yourself with Financial Knowledge Ignorance is not bliss when it comes to finances. Equip yourself with financial knowledge and skills to make smart money decisions. Take charge of your financial future by investing in your financial education. Remember, the more you learn, the more confident and empowered you'll become in managing your money. Don't wait, start your financial journey today! Craft Your Personal Financial Vision Your financial journey needs a destination. Setting clear and realistic financial goals gives you a sense of direction and purpose. Remember, every big goal starts with small, achievable steps. Take the time to plan your goals carefully and break them down into actionable tasks. Stay committed and motivated, and you'll be on your way to financial success. Cultivate a Circle of Positive Financial Influence The company you keep influences your financial habits. Surround yourself with positive role models and mentors who can guide you towards a healthier money mindset and inspire you to reach your financial goals. Remember, it's never too late to start making positive changes. With the right support and determination, you can achieve financial success. Embrace Gratitude Gratitude can shift your focus from what you lack to what you have. By appreciating your current assets, you can foster an abundance mindset and attract more wealth into your life. Remember, gratitude is not only about acknowledging the big things but also finding joy in the little moments. Embrace gratitude as a daily practice and watch how it transforms your well-being. Digitize Your Records for Easy Organization Digitizing your records can be a game changer when it comes to financial management. With a paperless system, you'll be able to access all of your important documents in one place, quickly and easily. This means no more rummaging through stacks of papers and folders. You can even use free online tools to convert to PDF and then edit as needed. Also, digitizing your records reduces the risk of losing important financial information due to fires, floods or other disasters. By having a streamlined digital system, managing your finances will become more efficient and stress-free. Master Emotional Intelligence for Financial Decisions Emotions can often cloud our judgment, leading to impulsive financial decisions. It's important to recognize and acknowledge your emotions, but also to take a step back and consider the long-term impact of your choices. By managing your emotions, you can make decisions that align with your goals and aspirations, setting yourself up for a more secure and prosperous future. Remember, a calm and rational approach is key to achieving financial success. Reassess Home Expenses Your home shouldn't be a financial burden. If housing expenses are straining your budget, it's time to evaluate whether downsizing might be an effective solution for you. Downsizing can not only help you save money on housing costs, but it can also free up funds for other important financial goals. Additionally, a smaller home can be easier to maintain and provide a simpler and more manageable lifestyle. Alternatively, consider renting an apartment so you can get yourself in a better financial position, if necessary. Look around online, assess different neighborhoods, and see if you can find something that suits your budget and lifestyle. Unleash Your Entrepreneurial Spirit for Greater Income Entrepreneurship can open up new avenues for income generation. If you're passionate about a business idea, it's time to take the leap and turn your dream into reality. Embrace the challenges that come your way and stay committed to your vision. With determination and perseverance, you can create a legacy that lasts a lifetime. Take Control of Your Financial Situation Forming a more prosperous financial mindset takes some time and effort. However, by addressing your financial fears, improving your education, gaining financial literacy, setting personal financial goals, surrounding yourself with positive influences, practicing gratitude, reassessing your expenses, and exploring entrepreneurial opportunities, you can pave the way for greater financial success. Remember – money is a tool that, when used wisely, can lead to a more fulfilling and prosperous life. Thank you Abby for the great guest post. -Paul R. Rossi, CFA  I’ve heard it said that 50 is the new 40, and 40 is the new 30. As a business owner, if you’ve been busy keeping all the balls in the air, running and growing your business but haven’t gotten around to planning for the day you eventually stop working, retirement or otherwise, this strategy is for you. If you are a small business owner (with no employees outside of your spouse), make over $200,000+ a year, are 45+ years old and haven't started saving for retirement, I have a plan for you to retire with $3,000,000. And if you're married, you can double this amount to $6,000,000. How? Using the tax code and a specific Small Business Retirement plan to your advantage. This retirement plan has advantages over the more common SEP IRA or other types of retirement plans. Here’s are the assumptions and plan: 45-year-old business owner, income of over $200k+ and $0 in retirement account.
15 years of contributions over a 20-year period, assuming a modest return, you'll have nearly $3 million dollars ($6 million if you include your spouse). Over this same period of time, you will have written off over $1 million dollars in business expenses and personal deductions that saved approximately $300,000 in federal taxes alone. You might be surprised as to what's possible, with proper planning it might just feel that we can turn back time. -Paul R. Rossi, CFA Interestingly enough, we may not even be aware this is happening. The last time I purchased a new car, seemingly out of nowhere I began to see the same car I just purchased everywhere. Magically my new car was much more popular than I previously realized. This phenomenon is powerful and is working behind the scenes all the time. Major events in our childhood, recent circumstances, education, relationships, our mental and physical health have meaningful impacts in how we filter, and thus how we see the world around us. How many people do you know that think investing in the stock market isn't much more than gambling? Or people that think gold is the only true store of wealth. Or people that feel the complete opposite. What is risky to one person, is considered a good time for another. Understanding how you view the world and why is extremely powerful in gaining an understanding of why you make the decisions that you do. The charts below, show all the same data, however, they represent how people might feel dramatically different while experiencing the same events. People will feel differently while the market is going through its gyrations over time. Some see risk, others see opportunity. The first two charts (respectively) show both bull and bear markets since the late 1950's but the y-axis of the two charts is not in the same scale. This is how some people might feel. The impact of losses is more powerful in relationship to gains. 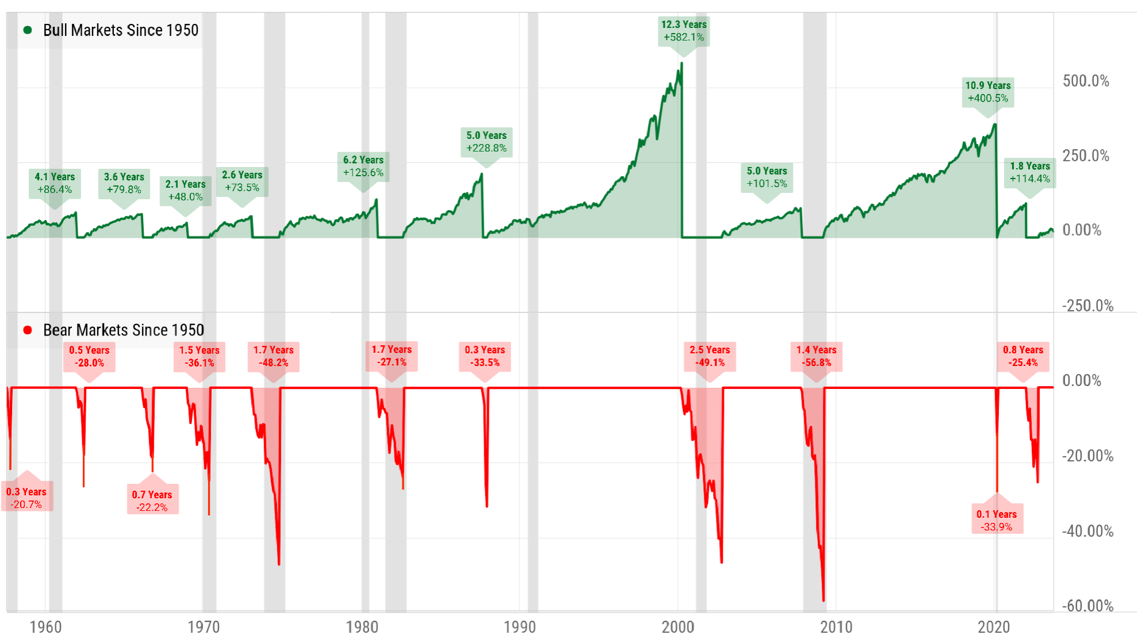 The chart below is more representative of the market during both bull and bear markets (same scale), but doesn't give the full picture as to what the market has achieved since the late 1950's. 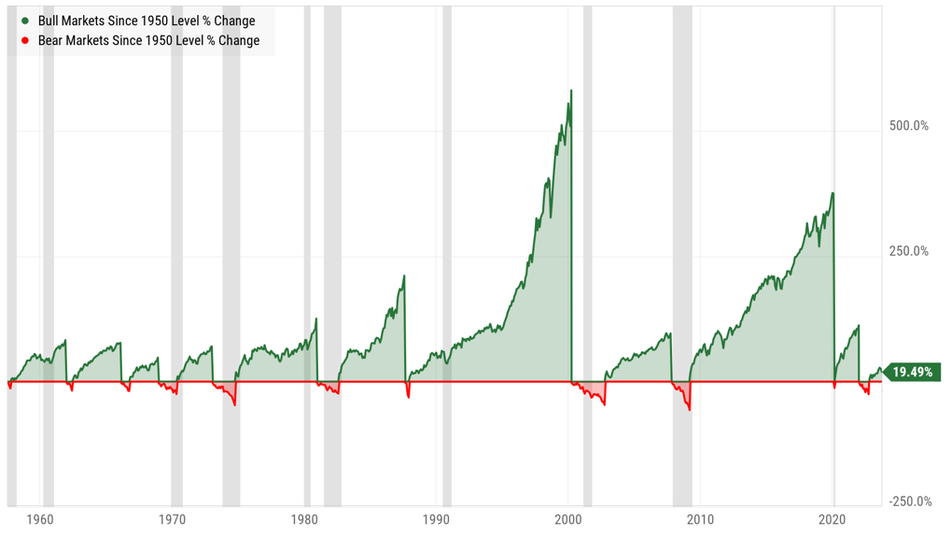 The chart below is the price return of the stock market over the same period of time. 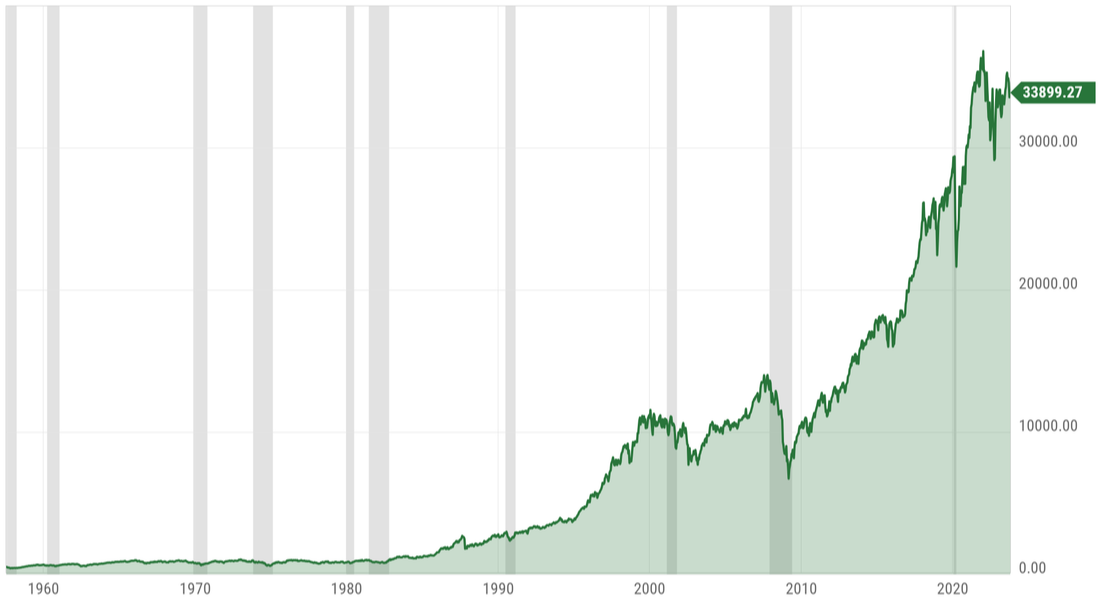 Same chart as above, now in log scale. 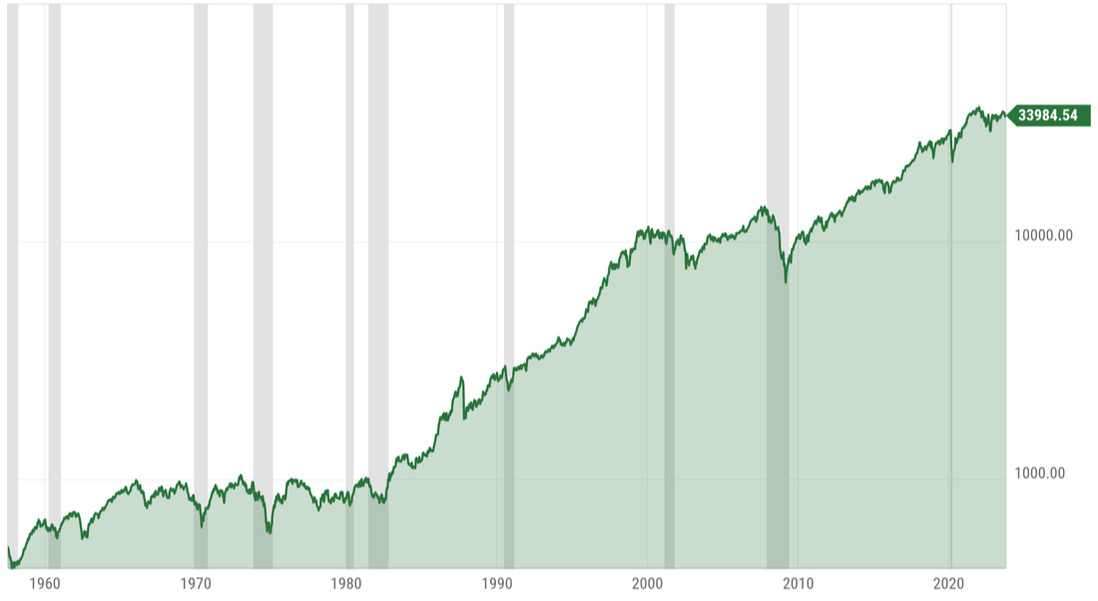 How do you view the market and why? -Paul R. Rossi, CFA |