 You be the judge. -Paul R. Rossi, CFA
0 Comments
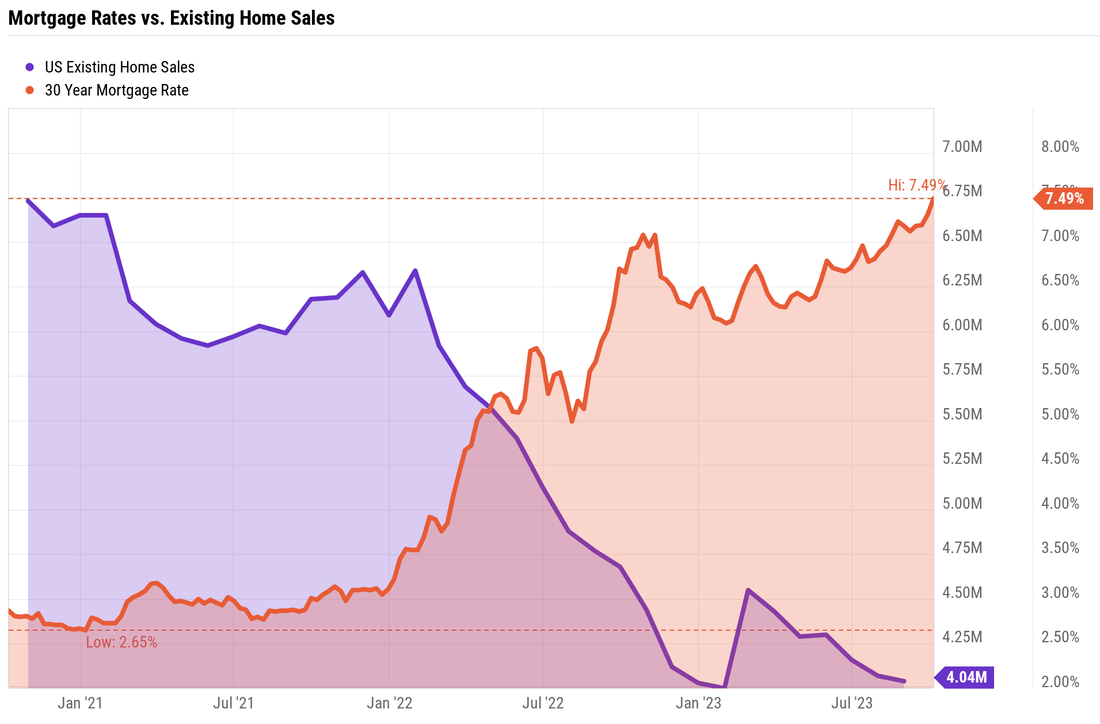
 Gas prices are near all-time highs. Home prices, along with mortgage rates are at 20+ year highs, which has caused housing costs to skyrocket. Core inflation is higher than it's been in over 30 years (albeit coming down). In spite of this, keep in mind what 99-year-old Charlie Munger said recently, "If I can be optimistic when I'm nearly dead, surely the rest of you can handle a little inflation." -Paul R. Rossi  This is a map of what Christpoher Columbus and his contemporaries thought the world looked like in 1490.
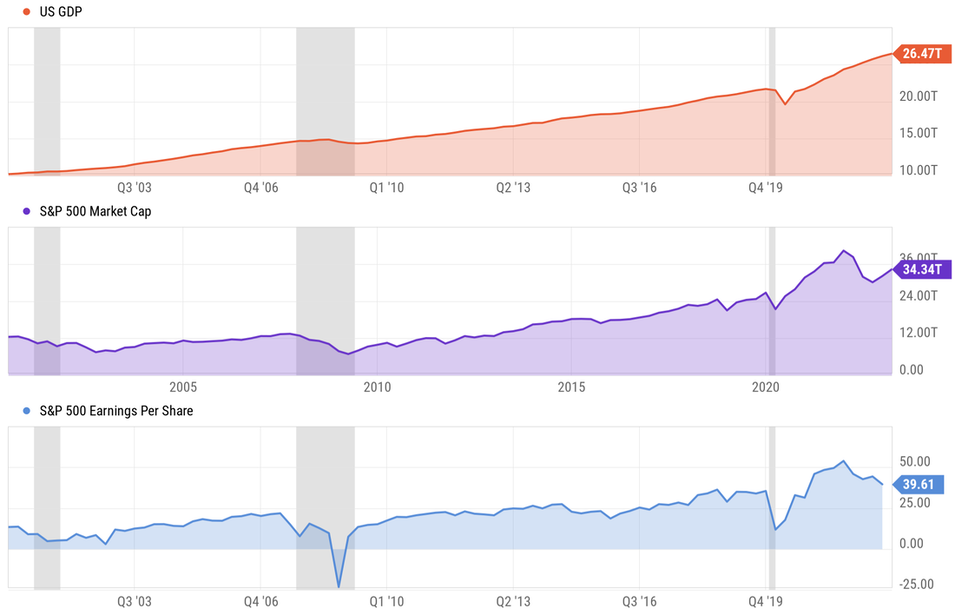
From our 20/20 vantage point today, it seems our ancestors were pretty far off from reality. What did it take to update our understanding of the world? It took many years of adventurous and sometimes dangerous exploration, it took better technology, and the willingness to change our beliefs. Which brings me to the idea of: What do we think we "know" today that will be proven wrong tomorrow. I'll go out on a limb and say there will many ideas today that will be proven wrong, in virtually every discipline, from physics, biology, anthropology, and psychology...just to name a few. As a financial advisor I read quite bit of financial related material, and from time to time, I come across investment products that make some pretty bold claims, like incredible returns with no risk. And when I come across these types of claims, I follow what has become known as the Segan Standard, "Extraordinary Claims Require Extraordinary Evidence." Carl Sagan, the famous astronomer, coined this aphorism, which is sometimes shorted to ECREE. The next time you hear about an extraordinary claim, before blindly believing it, or taking action, you would be well-served to remember ECREE. As Mark Twain said, "It ain't what you don't know that gets you in trouble. It's what you know for sure that just ain't so." -Paul R. Rossi, CFA 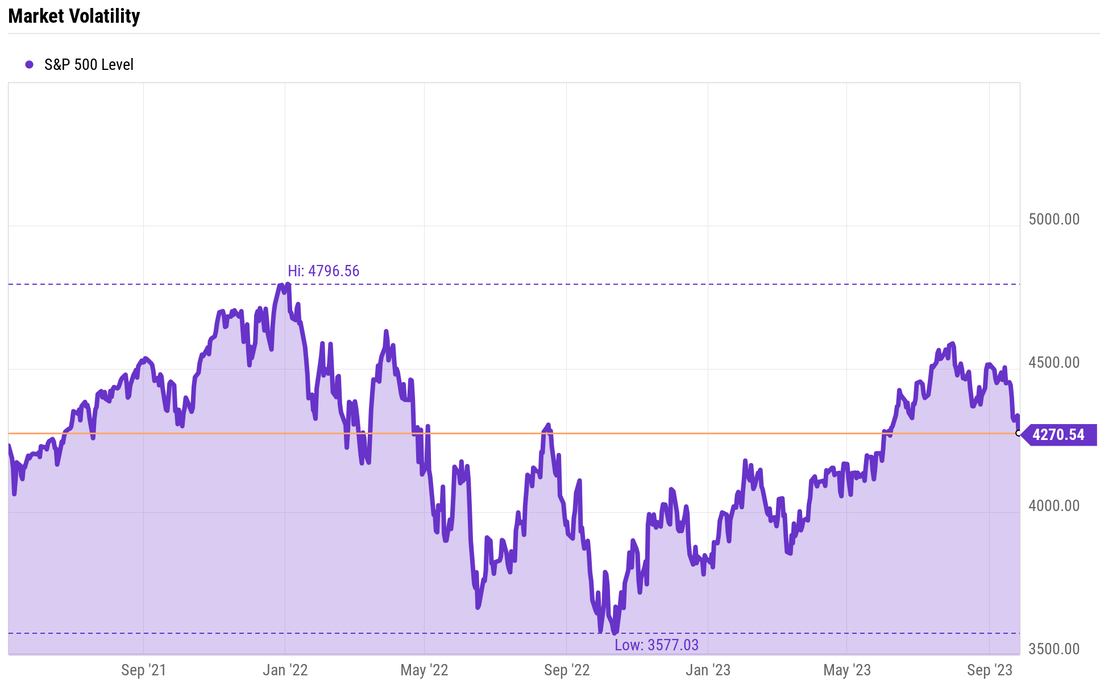 Did you ever watch those old cartoons where the dog or cat are running in circles going nowhere? If you did, then you might be able to relate to what the market has done over the last 2.5 years. The stock market is right back where it started back in April 2021. Some interesting facts over the last 2.5 years: If you would have bought at the high in 2021, you'd be down over 10% today. However, if you got lucky and bought in October 2022, you'd be up almost 20%. From its high in 2021 to the low in 2022, the market was down over 25% at one point. Is this anything new. Nope. Should we be worried about this. Nope. What did GDP (Gross Domestic Product) do over the same period of time? 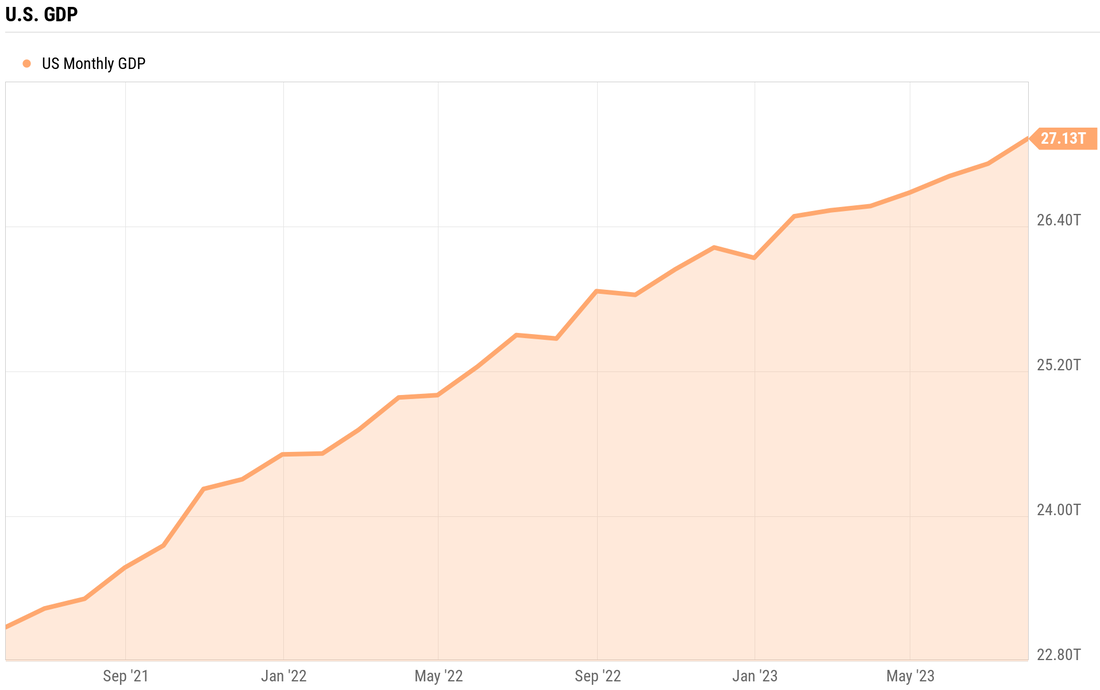 GDP went virtually straight-up from $23 trillion to over $27 trillion.
What's going on? Charlie Munger said at one point, "If you're not a little confused about what's going on, you don't understand it." This is what markets do, they provide very uneven returns. In the short-term, it can feel like we are going nowhere fast. -Paul R. Rossi, CFA  Magic mirror on the wall, who is the fairest one of all? It might just be short-term U.S. Treasuries. Why? Let me count the ways.
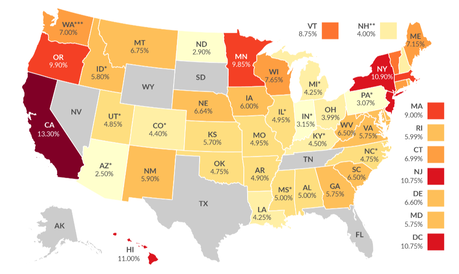 Maybe the evil queen was on to something. -Paul R. Rossi, CFA If you are a new borrower or needing to refinance a loan, the cost of money hasn't been this high in over 20 years. And it doesn't matter who you are or what type of product, rates (and therefore costs) are substantially higher.
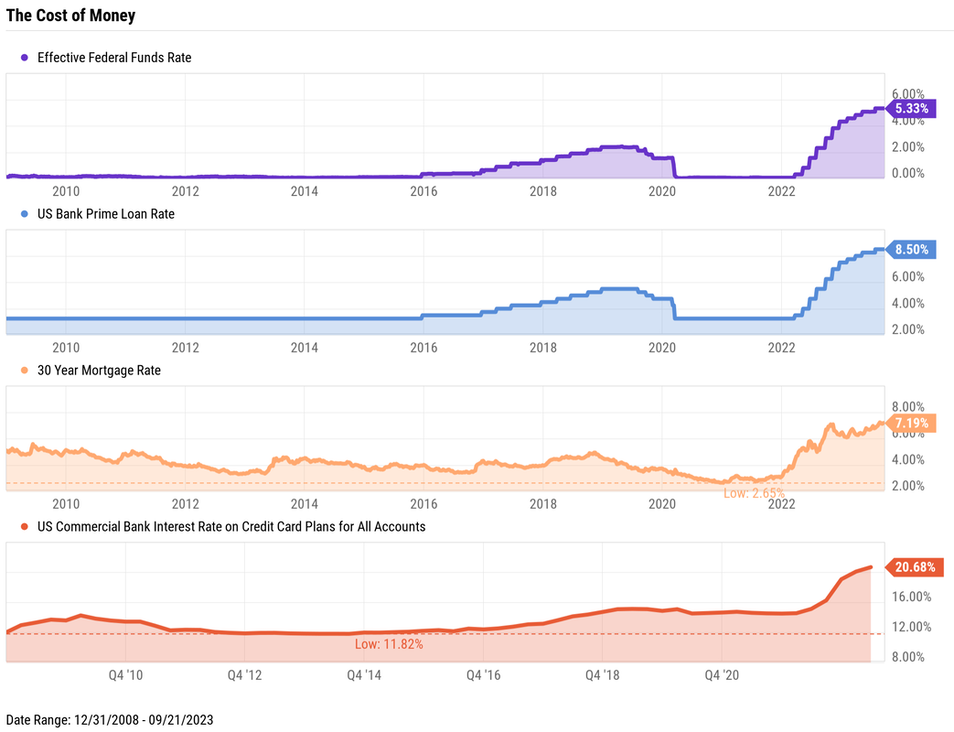 The game has changed. Banks and other financial institutions are charging substantially more, but... 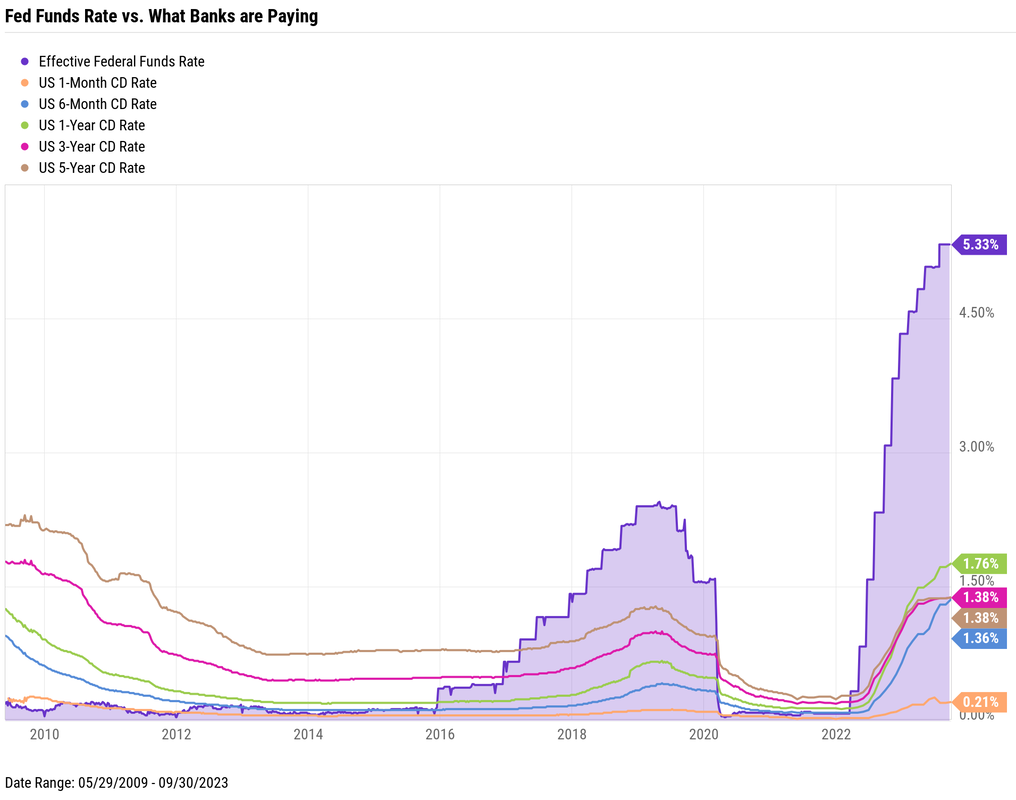 they are not paying much more.
When the game changes, players need to change. -Paul R. Rossi, CFA 
The whistle-blow signaling the kickoff of the NFL season is echoing far beyond the stadiums. It's marking the onset of an unparalleled era in American gambling, highlighting a cultural transformation we've witnessed in recent times. Betting Everywhere and On Anything. Today, the majority of Americans are just a click away from placing a bet. It's as easy as unlocking your smartphone. The digital age has transformed our devices into mini-casinos. With the rise of apps dedicated to gambling, even the NFL isn't immune to the lure of this rapidly expanding industry. Remarkably, the state's sanction gambling, making a tidy profit as it proliferates. Cultural titans like the NFL have endorsed it, intertwining sports fandom with sports betting. ESPN's recent collaboration with a sportsbook is testament to this growing trend. With over 1,000 casinos spread across the nation and an affirmative nod from the Supreme Court in 2018, sports betting is soaring. The 2022 gaming revenue is an evident indicator, setting a staggering record of $60 billion. With the current NFL season underway, 2023 promises to break even this impressive benchmark. The New Landscape From Vice to Virtue The name "Las Vegas Raiders" would've raised eyebrows a few decades ago. But today, with the NHL's Golden Knights just a stone's throw away and growing speculation around NBA's next expansion in Las Vegas, it's clear: gambling's once-taboo status has been overturned. From clandestine dealings, it has transitioned into the limelight of legitimacy. A Flip Side to the Coin However, with this exponential growth comes cautionary tales that America should heed. The rapid escalation in gambling doesn't come without its set of challenges. Although determining the exact number of gamblers transitioning from casual to compulsive is tough, there are indications of an increasing trend in gambling related problems. America can also learn from nations like the UK, where gambling has been deeply rooted for a longer duration. Alarming statistics, including thousands of children identified as problem gamblers and a significant percentage of suicides linked to gambling woes, shed light on the possible repercussions of unchecked gambling growth. Plan Responsibly As the NFL season is underway, heralding what could be the largest gambling season in history, it's crucial for all stakeholders – governments, institutions, and individuals – to approach this burgeoning industry responsibly. While there's undeniable excitement and potential profit, the societal implications should not be sidestepped. Balancing this thrilling pastime with education and safeguards will ensure a sustainable and healthy relationship with the world of betting. -Paul R. Rossi, CFA  Good Jocko Willink, former Navy SEAL lieutenant commander and author is known for saying "good" when bad news arrives. He has said, "One of my direct subordinates, pulls me aside with some major problems...one day he was telling me about some issue that he was having and he said I already know what you're gonna say," I said, "what am I gonna say," "you're gonna say, good, he said "that's what you always say when something is wrong and going bad, you always just look at me and say good." And I said "well, yeah when things are going bad there's gonna be some good that's gonna come from." "Didn't get the new high-speed gear we wanted, good. Didn't get promoted, good. More time to get better. Mission got cancelled, good. We can focus on another mission. Didn't get the job you wanted, good. Got injured, sprained your ankle, got tapped out, good. Got beat, good. Learn. Unexpected problems, good, we have the opportunity to figure out a solution. That's it. When things are going bad, Don't get all bummed out, Don't get startled, Don't get frustrated. If you can say the word “good,” guess what? It means you're still alive, it means you're still breathing, and if you're still breathing, well then hell, you still got some fight left in you. So, GET UP, DUST OFF, RE-LOAD, RE-CALIBRATE, RE-ENGAGE, GO OUT ON THE ATTACK. GET AFTER IT Watch the 2-minute Jocko video here. -Paul R. Rossi, CFA  Banking at the most fundamental level is a “spread" business. Traditionally banks take in deposits at “x” and loan them out some multiple of x, say “1.5x,” and the difference between what they pay in deposits and what they charge on their loans is called “the spread.” The bigger the spread the more they make. As an argute individual, the goal is to minimize the spread you pay, either by lowering the rate you pay on loans, or by increasing the rate being paid to you in your bank/brokerage, or both. Right now, there is quite a discrepancy between various interest rates being charged and being paid among banks, brokerages, mortgage companies, etc. For savvy borrowers, investors, and business owners, this is an opportunity. Here's an example: Mortgage rates today are higher than they’ve been in over 20 years. Hovering around 7%+. Ouch. Borrowing a $1M to buy a home today will cost you $6,650 a month (in principal and interest) at 7% with a traditional mortgage. Currently, many of the large banks are paying near 0-1% on their checking/savings accounts. So, the spread to the typical person could be 6%. (7% - 1%). There is a better option today for borrowers, rates are less than 6%, and it's a loan that doesn't use your home as collateral. How about paying $4,900/month instead of $6,650 on a $1M mortgage, a 33% savings on your monthly payment with a much lower rate of 5.88%. In addition to the lower rate, the loan would be interest-only, there is no underwriting, no credit score required, and cash in hand in just a few days. Couple this 5.88% loan with a 5.45% US Treasury Bill, and you've gotten the spread down to far less than <1%. (5.88% - 5.45% = 0.43%). Your win is the banks loss. Does this work for business loans, or auto loans, or any other type of loans? Yes. Sound too good to be true? It’s not, so what's the hitch? You have to have a sizable investment portfolio. *Retirement accounts do not qualify. Do you know your spread? -Paul R. Rossi, CFA 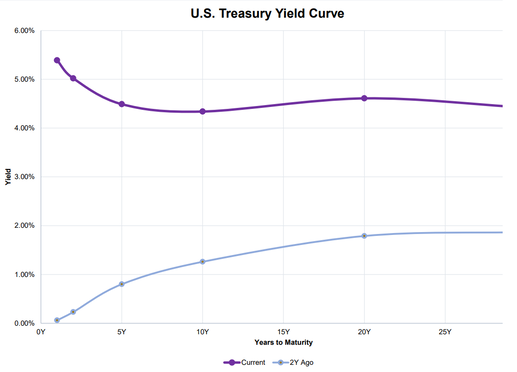 The 3-Month Treasury Bill rate is currently 5.48%, the highest among all US treasury maturities, it was near 0% at the beginning of last year. The 3-month rate is currently higher than the 3-year by 72 basis points. At the end of May, the 1-Month Treasury Bill eclipsed 6% for the first time ever and was the first treasury instrument to do so since 2002. This is a situation known as an inverted yield curve. An inverted yield curve is when shorter-term notes pay higher effective yields than longer-term bonds. The yield curve is considered “normal” when longer-term bonds yield more than shorter-term ones. An inverted yield curve historically signals that the broader economy might be headed for some tough times. Yield curve inversions are regarded by many as warning signs of a recession, as they have consistently preceded US recessions. They also indicate uncertainty in equity markets. How much should you worry about this yield curve inversion? Is a recession coming? And if so, how soon? Who tends to be the winners and losers of an inverted yield curve? What Inverted Yield Curves Mean for Recessions Generally, investors receive higher returns when they agree to commit their cash for longer time periods. The fact that an investor today can lock in a 5.48% effective annual yield with principal paid back in 3-months, but just 4.33% for one decade doesn’t sound quite right, does it? An inverted yield curve occurs when near-term risks increase. Investors demand greater compensation from shorter-term treasuries when long-term expectations for the economy sour. Inverted yield curves can be more clearly illustrated through yield spreads. Two of the most closely followed spreads are the 10 year / 2-Year Treasury Yield Spread and the 10 Year / 3-Month Treasury Yield Spread. The 10 / 2-year spread inverted at the beginning of July last year and has stayed negative since, stirring up fears of a recession. At the same time, the technical definition of a recession was met early last year when two consecutive quarters of negative GDP growth were logged between Q1 and Q2 2022. The 10 / 3-month spread is also a popular recession indicator and represents the relationship between long-term bonds and what’s often considered the risk-free interest rate. In late October, the 10-year/ 3-month spread turned negative for the first time since February 2020. There have been six major US recessions since 1976, per the National Bureau of Economic Research’s definition and ALL six recessions were preceded by an inverted 10 / 2-year spread lasting longer than two months. Each recession (other than the 2020 pandemic-induced one) occurred less than two years after the 10 / 2-year spread first inverted. An inverted yield curve doesn’t necessarily mean a recession will happen at the snap of a finger. Nor have yield spreads historically stayed negative for very long. In fact, recessions don’t typically occur while the yield curve is inverted. Instead, what often happens is that the yield curve starts to gradually “un-invert” shortly before a recession. This reversal is usually triggered by either rate cuts or the imminent possibility of them, leading to a decrease in short-term bond yields. Analysts believe the yield curve could remain inverted longer than usual due to the large yield gap and strong economy. The conclusion of the inversion will reveal whether it is caused by declining interest rates or new bets on the economy’s strength. Despite recent economic resilience, recessions have historically occurred within two years of a negative 10 / 2 spread. This, combined with achieving a technical recession by way of two consecutive quarters of negative GDP growth last year, explains the jump in near-term recession probability. How Consumers Can Be Affected by Inverted Yield Curves Consumers seeking short-term loans tend to be worse off amidst an inverted yield curve. Interest rates rise and costs of borrowing go up, leading consumers to either pay higher prices or defer purchases and investments altogether. This unfriendly environment tends to sour the consumer’s mood. Though yield curve inversions tend to precede recessions, decisions made by consumers can ultimately flip the switch and force the economy into contraction. For each of the six recessionary periods listed above, and also at the time of an inverted 10/ 2 year or 10 / 3-month spread, the University of Michigan’s US Consumer Sentiment Index was either declining, below its historical average, or both. The same goes for the US Consumer Price Index, which was either on the rise, above its historical average, or both in all six periods. The Consumer Sentiment Index hit an all-time low of 50 last June right as the 10 / 2-year spread turned negative, and inflation peaked at 9%. The index is currently around the same level as it was at the end of the Great Recession of 2007-2009. The 10 / 3-month spread moved in the opposite direction of consumer sentiment last year. As the Consumer Sentiment Index plummeted to historical lows, the 10 / 3-month spread widened. It seems the 10 / 3-month spread caught up to the reality of depressed consumer sentiment and the highest CPI in four decades. How Equities Can Be Affected by Inverted Yield Curves Companies in the business of short-term borrowing and long-term lending, such as banks, have historically underperformed when the yield curve inverts. Borrowing costs increase near-term, and profits get compressed when long-term loans are issued with less attractive rates. Stocks bearing high dividend yields are also thought to be less attractive when short-term rates spike. Yield-seeking investors may flee equities in favor of shorter-term treasuries since payments can be captured without inheriting company risk. On the flip side, companies that issue short-term loans would expect to see a bump in interest payments. The same goes for companies with large amounts of liquid assets on their balance sheets. How Fixed Income Can Be Affected by Inverted Yield Curves Inverted yield curves raise short-term US treasury yields closer to those of riskier bond types such as junk bonds, corporate bonds, and also real estate investment trusts (REITs). When the spreads between lower-risk US treasuries and these higher risk, non-Treasury backed securities contract, the US treasuries are typically seen as more attractive. When a flat or inverted yield curve lifts short-term treasury rates closer to or greater than long-term ones, this presents a situation in which investors could lock in a similar interest rate at a lower duration (lower interest rate sensitivity) to maturity. One thing to note: if short-term rates continue rising, then that bond value would likely decrease. However, assuming the investor is willing to accept implied short-term risk and believes the issuer, in this case, the US government won’t default, he or she might have an opportunity to achieve a greater effective yield. The Bottom Line The yield curve has been inverted since July 2022, but history has shown that any economic fallout following a yield curve inversion doesn’t happen immediately. Investors that take cues from the 10 / 2-year spread might look to the 10 / 3-month spread as well, as both have preceded all six recessions that have occurred dating back to 1980. 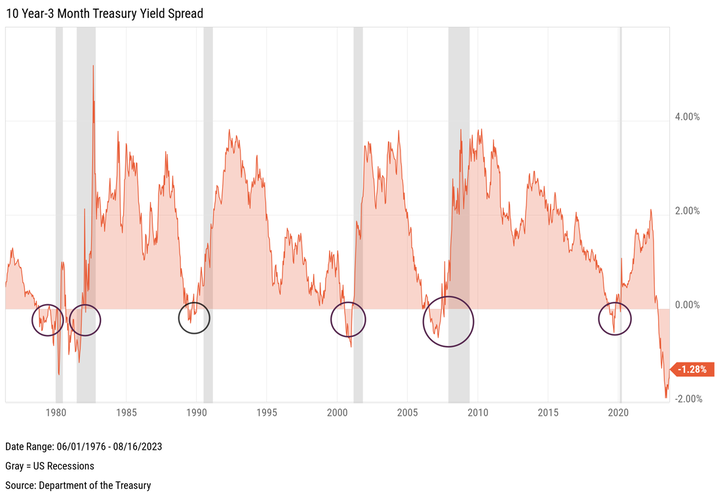 -Paul R. Rossi, CFA  As the digital age reshapes some traditional norms, a dramatic shift in the sources of financial advice is emerging among investors. Betterment, an online investment company, recently surveyed 1,200 investors from Gen Z to baby boomers about their preferred sources of financial information. The study revealed a startling trend: more than half of Gen Z and millennial investors are receiving financial advice from social media. Simultaneously, the survey found that financial advisors are the most trusted source of advice, with 67 percent of respondents ranking them in the top three. Meanwhile, social media influencers lagged, with only 22 percent ranking them within their top three. This intriguing data prompts a deeper exploration into the risks and rewards of sourcing financial advice from social media influencers versus licensed financial advisors. Social Media: New Face of Advice? Social media influencers, with their enormous online presence, have emerged as a significant source of financial advice for investors. Influencers often share personal anecdotes and strategies that have worked for them, or promote certain financial products, offering sometimes a very relatable and accessible source of financial advice. However, despite their appeal, there are noteworthy potential risks associated with relying solely on influencers for financial counsel:
Financial Advisors on the other hand are required to:
What are the benefits of using a Financial Advisor?
Just a couple, or even one significant bad financial decision can have major implications, potentially damaging your financial well-being. The onus remains on investors to discern between advice that is based on trying to promote clicks, selling financial products, hearing half-truths, or get rich quick schemes, vs. advice that is personalized, grounded in sound financial strategies that comes from a trained, and regulated fiduciary advisor. -Paul R. Rossi, CFA Note: While I freely admit that I might be biased as I run a financial advisory firm, it doesn't change my core belief that working with a professional advisor is typically more prudent than taking advice from a social media influencer. 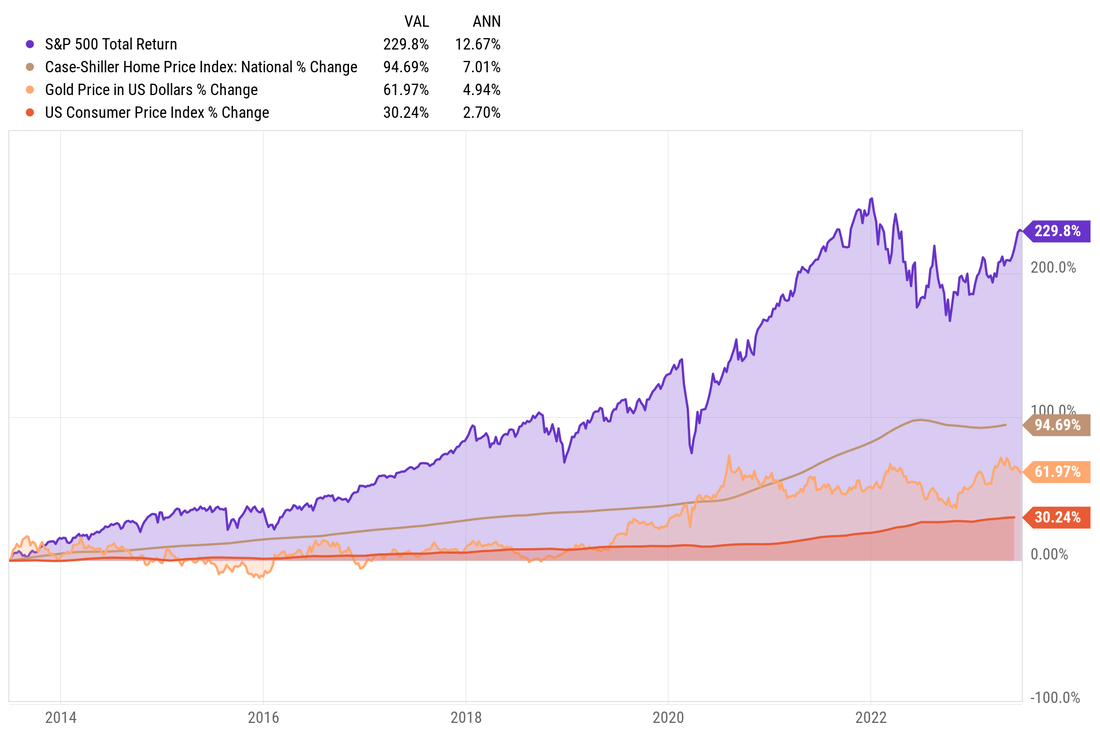 How can we beat inflation? Own assets. What type of assets? Assets that appreciate and/or produce income greater than inflation over time. While history is not a perfect predictor of the future, it does tell us what has happened in the past. And if the future is anything like the past, then history can be helpful. In this case, I believe history can be used as a guide. Over the past 10 years, the consumer price index (a proxy for inflation) has increased by just over 30%; which means that prices on a general basket of goods is 30% more expensive than they were 10 years ago. If you've bought anything recently you, know it's more expensive than it was 1 year ago, and quite a bit more expensive than it was 10 years ago. Knowing this, it's important to own assets that have, and will continue to grow faster than inflation. How do we overcome this general level of price increases?
Investors in gold, real estate, and the stock market have done well over the last 10 years and have kept investors significantly ahead of inflation. Will the future look exactly like the past, the short answer is no, but it won't surprise me if it looks somewhat similar. -Paul R. Rossi, CFA  Valuation matters. What is valuation? It is determining what something is worth. In terms of the stock market, it’s determining what a company is worth. There are various valuation techniques that are available, some more precise than others. "Valuing a company," according to NYU Finance Professor Aswath Damodaran, also called the Dean of Valuation says, "is part science and part art." As valuation techniques require the idea of making forecasts about the future which is fraught with difficulty. They also require generating a compelling story around what the future might look like. Let’s review a couple of very successful companies where their valuation got ahead of their price. Back in 2000 Microsoft’s shares got as high a $58 a share (split adjusted), the company and stock had done quite well for many years leading up to early 2000. However, the future played out quite differently for shareholders who purchased in 2000. It took over 16 years for Microsoft’s stock price to get back to this previous high of $58 a share. During this 16-year period, the stock lost over 74% of its value at one point. What’s interesting, over this same time period, Microsoft’s revenue more than tripled, net income more than doubled, and earnings per share tripled as well. It’s important to consider if you bought the stock in 2000, and were 30 years old at the time, you would have needed to hold until you were 46 just get to back to even. All the while, during this same time the overall stock market gained 100%. This was a massive opportunity cost. Do you think you could have held Microsoft stock for 16 years only to get back to break-even while the overall market did quite well? Not many could. Microsoft tripled its revenue and earnings per share while the stock performed horribly. How can this happen? It comes down to valuation. It’s PE and PS ratios in early 2000 were 73 and 30 respectively, which by most historical valuation metrics is extremely high. Over the course of the next 16 years these ratios were pushed down to as low as 8 and 2. Before finally coming back to more historically long-term averages. It can get even worse. Cisco Systems reached a high of $80 per share in early 2000 and 23 years later is still 36% below its high from 2000. How has the underlying business done? Revenue over the last 23 years has almost tripled, and its earnings per share has grown over 500%. Back in 2000, Cisco’s PE and PS ratios were over 200 and 35 respectively. Investors who purchased 23 years ago have lost money as the company’s valuation has come down. This drives home two important points:
These are just two examples, however, there are countless others. -Paul R. Rossi, CFA 
You'll read headlines about life hacks and shortcuts. If that’s what you're looking for, keep reading to learn anti-hack "secret." Becoming an expert, mastering a skill, and deep understanding takes time. I’m impressed with the people who put in the time and commitment to excellence, who are always striving to improve. Developing into a chess grandmaster, an Olympic athlete, or professionally playing a musical instrument takes countless hours of practice…in fact, it takes thousands of hours. Over the course of my martial arts training, I’ve executed more than 40 thousand front kicks along with countless other types of kicks. There are no short cuts, I put in the hours. Don’t get me wrong, there are smarter ways to train, but there is no short cut for putting in the time and concentrated effort. After almost 30 years of training, I am still working on improving. Ironically, the further down the path I go, the mirage of any actual destination has been replaced by the understanding that the journey is the destination. People who have a single-minded mission understand the idea of compounding. They understand consistently striving to make small improvements over time creates massive advances. Let’s take the simple idea of making a 1% improvement, and let’s say we do this every day for just 1 year. Initially, you might think over the course of a year would lead to an improvement of 365%, which would be a massive improvement from where you began, but you’d be wrong. Your improvement would actually be over 3,778% (1.01^365). This is the power of compounding small numbers consistently. How do we become an expert? It's a 1-step process:
Malcolm Gladwell popularized the idea of the 10,000-hour rule, taken from research done by Professor Anders Ericsson, which states that to become an expert in anything, it takes 10,000 hours of diligent practice. More recent literature has modified that a bit, to say there is typically a range somewhere around that number. Either way, no matter where you start, often the most difficult part is starting. So start. The sooner you start, the sooner those hours of diligent practice will compound. Robert Greene wrote a book called "Mastery," and through his extension research on the subject he found when a person becomes a true master in their chosen field, they are able to see and make connections between disciplines that others cannot, they begin to think and move at a higher level, almost like operating in a higher dimension. Success in nearly every endeavor takes time and lots of diligent practice. Most people will only see the “finished” product of your effort, completely missing what it took to get there. The so-called "overnight" success takes countless hours of repetition, study, and self-reflection. Ironically, the secret to mastery is wrapped in hard work, and that’s the secret. It’s hidden in plain sight if people really want to look. -Paul R. Rossi, CFA  What is an investment beast? An investor who doesn’t get scared out of their long-term plan. An investor who knows what they want and will stop at nothing to achieve it. Beasts are relentless. How do you become a beast? Do things that scare you a bit. You want to expose yourself to scary, uncomfortable, and difficult things. Over time, exposure to these stressors builds confidence. Confidence builds resilience, and resilience builds beasts. Right now, the so-called big scary topic of the hour is the debt ceiling. History of the Debt Ceiling. The debt ceiling was first established over 100 years ago by Congress. Prior to this, Congress was required to approve each issuance of debt in separate legislation. Since the end of World War II, our legislators have increased the debt ceiling more than 100 times, and it has increased from $300 billion to just under $31.4 trillion (over 100x). Repeat, Congress has raised the debt ceiling over 100 times. Be a beast, don’t let scary headlines scare you out of your long-term plan. -Paul R. Rossi, CFA Economic chaos has been extremely hard on small businesses. With economic volatility, many businesses have had to take extreme measures in order to keep their doors open and continue to grow. We’ve put together some tips and tricks that will help you keep your small business growing despite the current uncertain climate. Try Out Several Digital Marketing Techniques The digital world is constantly changing, meaning it is important for small business owners to be flexible and experiment with different digital marketing strategies. Now more than ever before, it is important for businesses to be creative and reach out to potential customers through digital channels like social media platforms and email campaigns. Experimenting with different strategies can help you find the most effective way of connecting with your target customer base. Benefit from Financial Assistance Programs Many financial aid programs are available for small business owners who are struggling during this difficult time. These programs provide much-needed capital injections that can help businesses stay afloat while they navigate this uncertain economic period. Research which programs are available in your area so that you can take advantage of them if needed. Monitor Your Cash Flow When running a small business, managing cash flow is crucial to ensure its success, particularly during tough economic times. It is vital to keep track of expenses and create detailed budgets to understand where the money goes each month. Moreover, the timely collection of payments from customers will help maintain a steady cash flow and avoid any unnecessary disruptions. Reduce Spending During this challenging time, businesses should focus on reducing expenses to ensure their continued success. Carefully review all expenditures and consider cutting back on office supplies or switching providers in order to save money. Additionally, reducing employee hours, if feasible, or implementing remote working policies can help reduce overhead costs while keeping employees engaged. Reach out to your vendors and ask about ways to reduce fees paid to them. Utilize Accounting Software Investing in accounting software can help ensure accuracy and security when dealing with accounts payable and receivable tasks. It streamlines processes such as invoicing and payroll calculations — helping to avoid costly errors and giving you peace of mind. Accounting software solutions are excellent options for small businesses looking for an easy way to manage their finances without sacrificing time or accuracy. Maintain Employee Engagement and Motivation Small business owners must prioritize their employees’ engagement and motivation even during times of uncertainty, as happy workers are essential for a successful business. Clear communication about any changes made in light of recent events, as well as future plans, is imperative for creating a secure work environment for employees. Furthermore, offering incentives such as flexible working arrangements or reward bonuses can be effective in boosting employee morale and engagement. Improve Efficiency With a Project Management Platform Using a project management platform can increase team collaboration and productivity, as it provides a centralized location for sharing information, assigning tasks, and tracking progress. It helps businesses streamline their workflows, improve communication, and ensure transparency and accountability throughout the project lifecycle. Take a look at this software if you want features such as real-time updates, progress tracking, and analytics that can provide valuable insights to help businesses optimize their project management processes. During turbulent economic times, small start-ups can stay afloat with the right approach. By experimenting with digital marketing strategies, investing in project management software, and prioritizing e-commerce, businesses can better weather any storms that come their way. This guest article was written by Abby Holt of Craftability. -Paul R. Rossi, CFA Since 2000, we have experienced.
In spite all these challenges, here are the facts:
 How is this possible? The American people by and large wake up every day and want to improve their lives and improve the lives of their family. While far from perfect, our social structure allows almost anyone to pursue these dreams. Our unique time and place in the world is an incredible driver for opportunity, innovation, and growth...both individually and collectively. Charlie Munger recently said, "Never under-estimate a person who overestimates themselves." I would argue, this idea can be more generalized to the overall United States and its people. We have achieved more than what any other country could have imagined 247 years ago when our fledgling country fought for its independence. As Warren Buffett famously said during the financial crisis, "Never Bet Against America." -Paul R. Rossi, CFA  Jamie Diamon is undoubtedly the most well-known and most respected banker in the world today. He has guided and has helped manage JPMorgan through some of the most difficult financial times, including through the Great Financial Crisis. The recent First Republic Bank transaction adds to Mr. Dimon’s legacy, it has become easy to draw comparisons between him and the man for whom his bank is named. Back in 1907, John Pierpont Morgan Sr. famously locked his Wall Street peers inside his office and refused to let them out until they agreed to join him in bailing out the panic-stricken financial system. Another nod to Jamie's stellar reputation came from Warren Buffett back in 2012, when Buffett suggested that President Barack Obama make Mr. Dimon Treasury secretary. While he wasn't interested in the Treasury position, Mr. Dimon is now Wall Street’s longest-serving C.E.O. "Most decisions are not binary, and there are usually better answers waiting to be found if you do the analysis and involve the right people." - Jamie Diamon, CEO of JPMorgan In terms of your finances, find your people that can help you with these non-binary decisions:
Life is full of decisions that are not answered with a simple yes or no. -Paul R. Rossi, CFA Note: The term, "find your people," I first remember hearing many years ago from a friend of mine Vinny Catalano. I give him credit for igniting the idea of how important, powerful, and enjoyable it is when working with the right people. Thank you Vinny. We experience 4 seasons every year, with one season leading into another. Nothing we don't already know. However, I would argue that tax season is the only season that is year-round and isn't something to start thinking about just before they are due. There are two distinct considerations in terms of taxes.
Tax planning is a year-round endeavor, tax filing is not. Looking back at the minimum and maximum tax rates over the last 100+ years, it's imperative to know where you fall within the tax schedule, and how to plan and act accordingly. 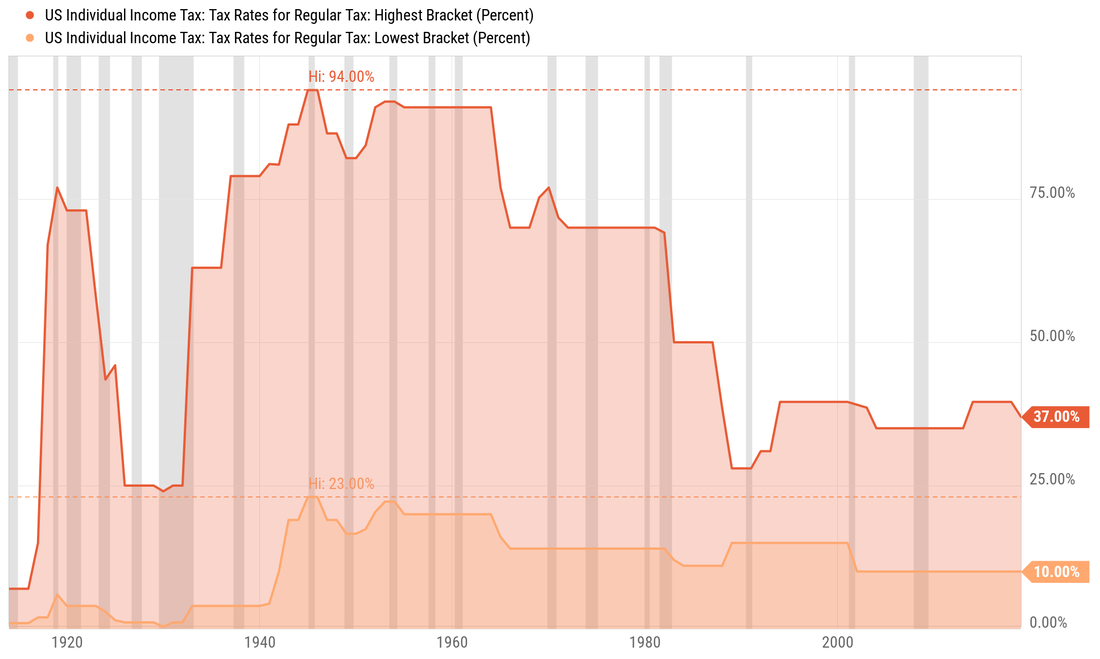 You would be hard pressed to find someone who thinks tax rates will be lower than they are today. What are you going to do now to capitalize on this? You can't change the past, but you can change your future. -Paul R. Rossi, CFA The chart below shows monthly stock returns going back over 70 years. Tons of volatility and pain. No wonder investing is hard. 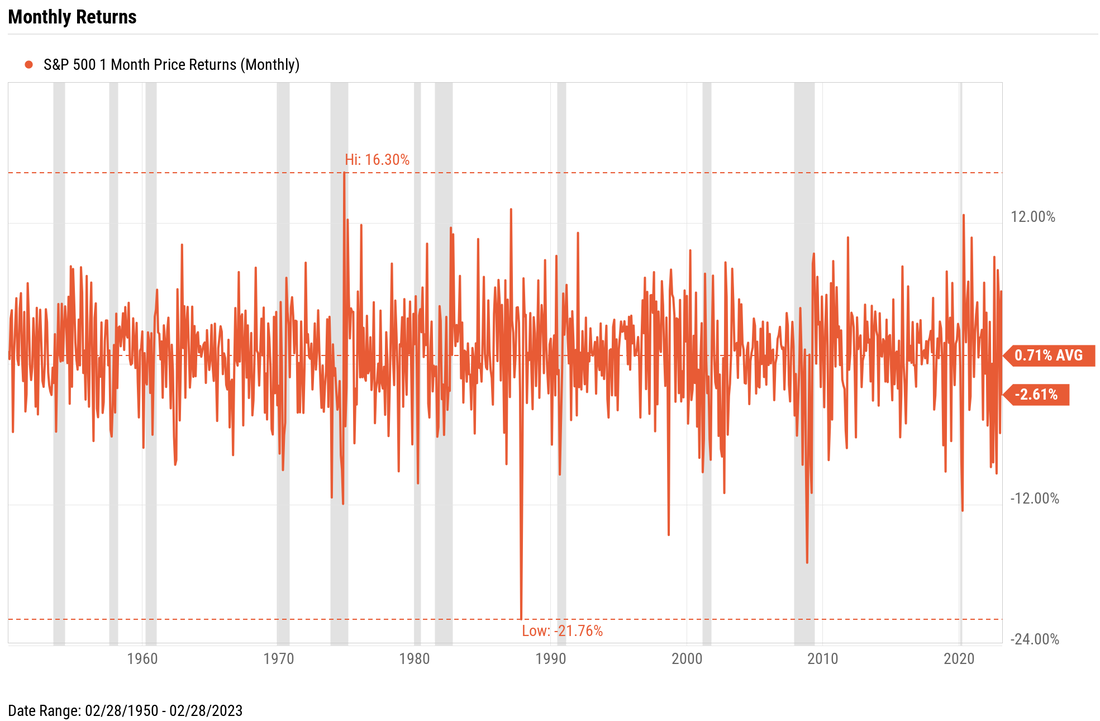 We live in the present, or at most, we live in the very recent past, say a month or so at a time. We tend think about what just happened, and then, most of the time, we think about a month or so in the future. Conversely, people who can successfully regulate their ability to sustain short-term pain have been handsomely rewarded. In less than 50 years, those painful monthly moments resulted in generating more than 1,200% returns, turning every $1 into over $120. Mic drop. -Paul R. Rossi, CFA  Warren Buffett has said more than once that “risk comes from not knowing what you're doing.” So let's take a look at a situation that arose from not completely understanding how things work due to details that might not be fully understood. There is an underlying idea that permeates the financial world that says bonds are safer than stocks. And at the top of this “safety” structure US Treasury bonds reign supreme, as they are backed by the full faith and credit of the US government. US Treasury bonds are considered the safest investment by investors the world over, and most, if not all interest rate products (mortgages, credit cards, bank savings rates, etc.) are related in some way to what US Treasury bonds are paying. So an investor who understands these ideas, decides that they wants to be super “safe” and invest in US Treasury bonds. And in doing so they also understand that there are U.S. Treasury funds available. Again, with the understanding that a fund adds diversity and can reduce risk further, this line of thinking makes intuitive sense. Let’s recap:
With the above criteria, it wouldn’t be unreasonable to think that investing in a US Treasury bond fund such as VGLT (Vanguard Long-Term Treasury) makes sense. If an investor bought this US Treasury bond fund just over 2 years ago (before the Federal Reserve started hiking interest rates), they would have experienced a -45% drawdown at one point, and would still be down over -37%. Ouch! How did the “risky” stock market do during this same time period? The max drawdown was -25%, and as of today the stock market is down -14%. So much for the blanket idea, that bonds are safe, and stocks are risky. 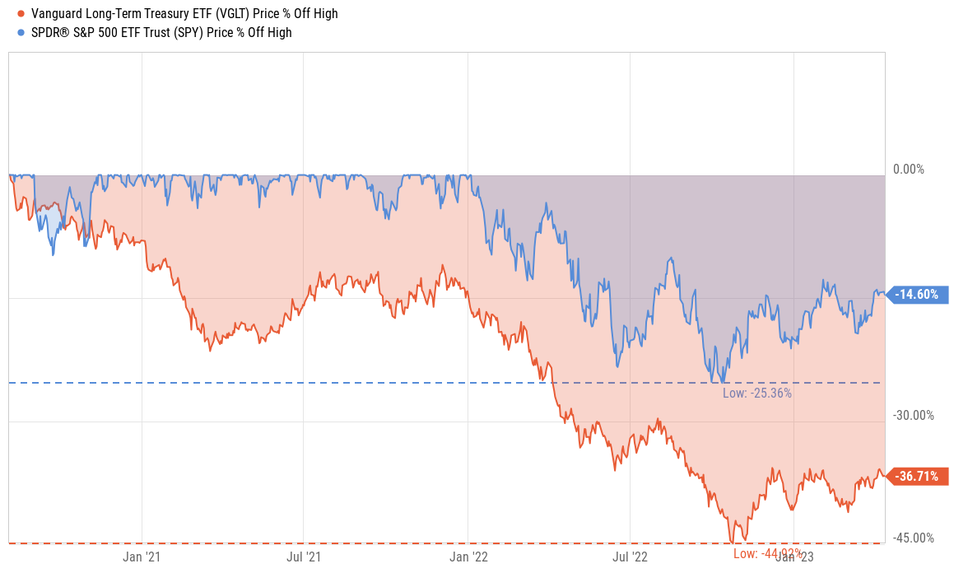 So are US Treasuries actually safe? That’s a complicated question and answer. The devil truly is in the details, and why ALL medium to long-term bonds (not just US Treasuries) lost so much value. -Paul R. Rossi  How Much Can You Afford? The first step in buying your vacation home is knowing how much you can afford; note that you may be required to put down 20 percent or more for a down payment. If you already own your primary home, CNBC notes that it might be easier to secure another property by refinancing your existing property to free up some cash for your future investment. Moreover, if you have managed to build up quite a bit of savings in a retirement savings account, then this could also help you to come up with most of the down payment amount required for your vacation rental. There might also be other costs that you'll have to consider from an affordability point of view, including property taxes, business insurance, property management costs, etc. If you have to apply for a mortgage, the amount you could qualify for and the interest rate you will be charged will be higher with an investment property as there is usually more risk involved. Look For Suitable Vacation Listings. The next thing would be to look for suitable vacation listings on sites such as HomeToGo and Mashvisor in your area to see what your options are before going ahead and purchasing a vacation rental just for the sake of it. This is where it may be helpful to compare property prices in the area to see what the going rate for similar properties are so that you can get all the features you are looking for at the most competitive price. What Will You Do with Your Vacation Rental? If you desire to rent it out to help supplement your expenses for now, then you'll have to consider all that goes along with renting out your vacation home to tenants. You will have to forgo your own vacation needs while you work on building up capital for one day when you can retire there without any financial worries. Then there is the issue of managing the property, which you may not have the time or expertise to do. A property manager can take over this responsibility, but it will come at a cost; it will then be up to you to decide if you can afford to take on this financial risk or not. Establishing a Business If you plan to launch your vacation rental business, you'll need to register it accordingly. If you register your vacation rental as an LLC, then you will be given the assurance that your personal assets will be protected from litigation. There are also other benefits, such as certain tax advantages, that might end up working in your favor. If you are unsure of how to start an LLC, then you can look this up online. The News Hub points out that a formation service can assist you with this at an affordable price. Looking ahead to purchasing a vacation rental is something that many look forward to with excitement and longing. Waiting until you're a little older, more financially savvy, and financially secure should provide an even easier pathway to achieving this dream. This guest article was written by Abby Holt of Craftability. -Paul R. Rossi, CFA You should not invest in the stock market, the bond market, the commodities market, or any market if you cannot handle volatility. Period. Why? Because, by nature these markets are volatile. If you cannot stomach seeing the value of your account go down, don't invest. People that cannot withstand this, will act counter to their best interests and many times will lose money. My professional advice would be to not invest. The chart below to an untrained medical professional might be mistaken for an EKG chart. But it's actually the 3-month price return of the stock market over the last 70+ years. No doubt about it, on a quarterly basis, the stock market is volatile, there have been several times that the market is down 20+ percent, and dozens of times it's down 10 percent. 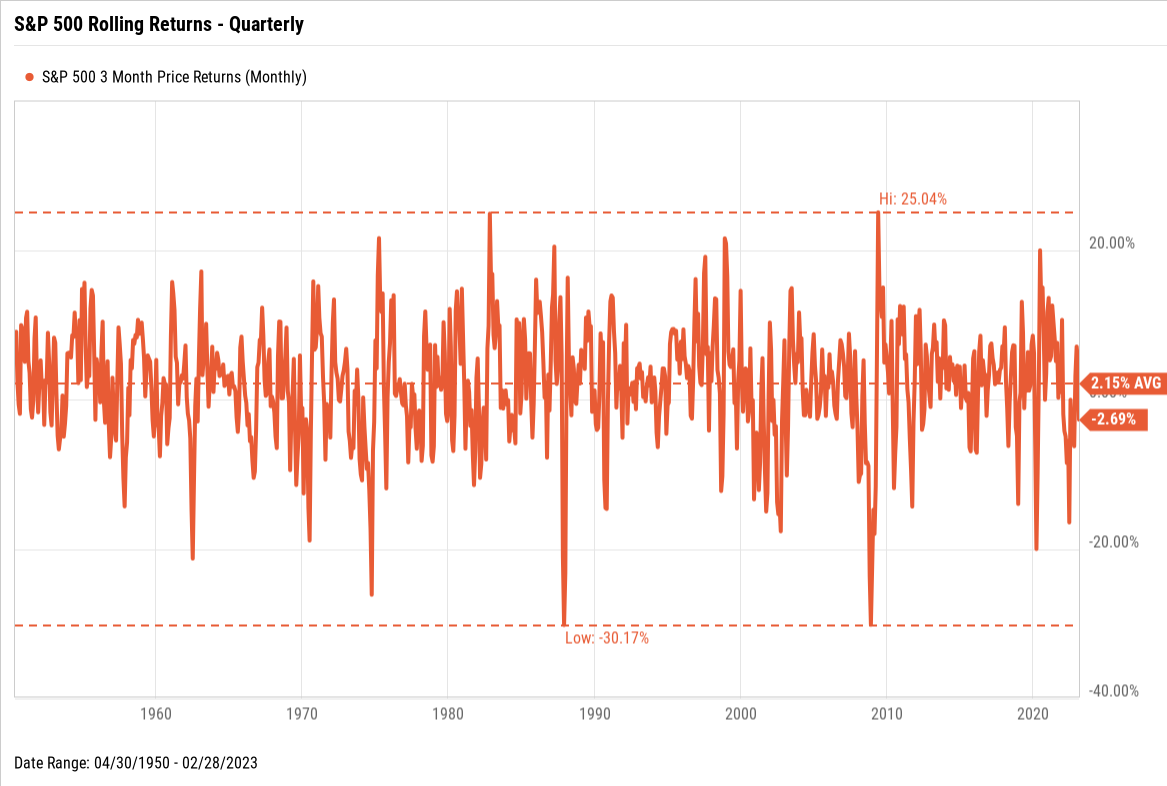 Like most things in life, you will see what you focus on. If you focus on the short-term, that is what you will see. Below are the price returns of 3 different rolling return time periods, from 5-years to 20-years. Revealing that when an investor who is willing to think and act long term is rewarded. Since 1950, historically there has never been a 20-year rolling period (purple line) that produced a negative return. 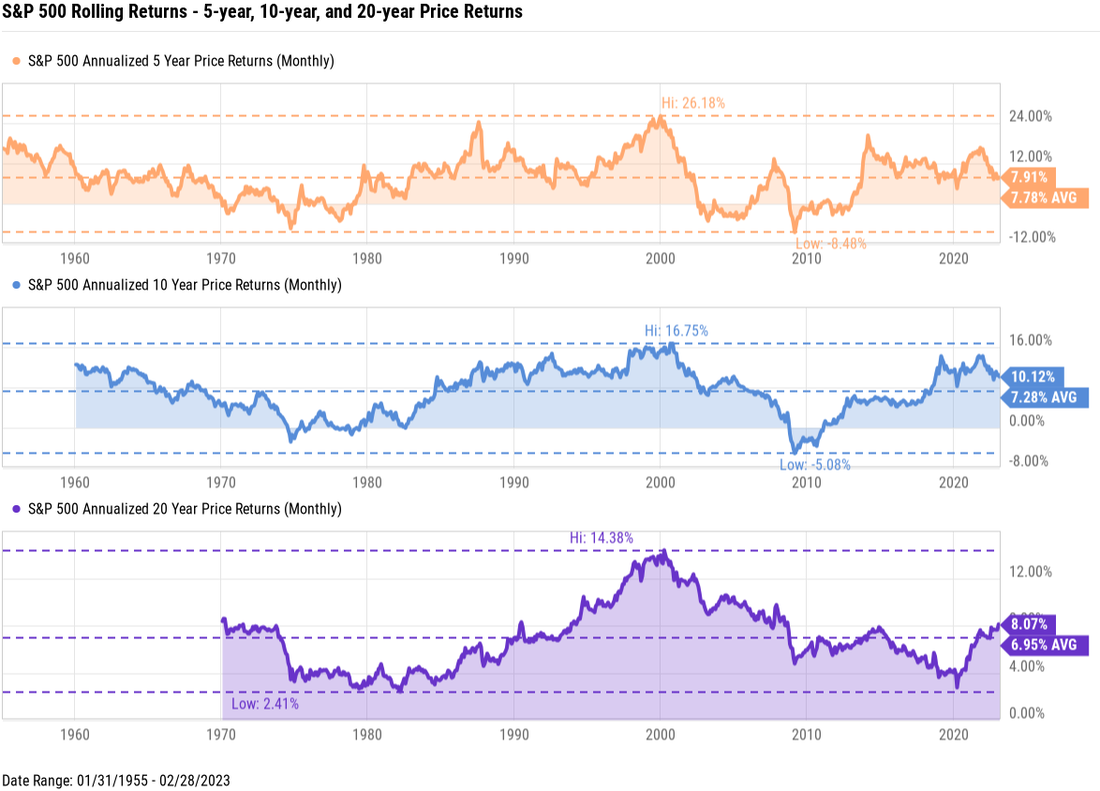 So what do these charts tell us? Your likely hood of losing money in the stock market goes down significantly the longer you are willing to endure the pain of short-term volatility. If you have a difficult time experiencing volatility, then you have three choices:
-Paul R. Rossi, CFA  I'm sure you've heard by now that Silicon Valley bank that was closed by regulators late last week. A little back story, interestingly enough, a little over 20 years ago, I worked for a bank that competed directly with Silicon Valley bank. The bank I worked for, The Venture Banking Group in Palo Alto, financed early-stage venture backed technology companies. We were a division of a larger regional bank called Cupertino National Bank which subsequently years later was purchased by Wells Fargo. Our parent bank, Cupertino National Bank was always mindful of not being overly concentrated in technology related startup companies and therefore our division was a relatively small group within the larger regional bank. This was for prudent risk management purposes. The 800-pound gorilla was Silicon Valley Bank, as they dominated the venture banking market. From what I've reviewed of Silicon Valley Banks balance sheet and read about the events that took place, there were two primary driving forces that caused their quick collapse:
The poor risk management was a mismatch between their short-term liabilities (bank deposits) and their asset base (customer loans and investments). Their huge misstep was purchasing long-dated treasuries and mortgage-backed securities. Bankers will tell you that it's imperative to match your assets and your liabilities. Silicon Valley Bank didn’t do this, and any hedges they had in previous years were taken off by the end of 2022. Credit quality was NOT the issue like it was during the financial crisis, it was a timing issue. A Very Simple Example: Imagine you said that you need money next month for a large down payment on a home, and instead of keeping the money in cash, you took the money and invested in something that could lose substantial value over the next month. This wouldn’t be prudent, even if the investment was guaranteed to do well over the long-term. In this example, your need for cash is short-term, but your investment was long-term. This is what’s called an asset-liability mismatch. What Does This All Mean? The various regulators stepped in and are guaranteeing that all depositors will be made whole. However, the investors (stockholders and bondholders) and executives will not get the government guarantee, so they are expected to lose a lot. Which I think is the right thing to do on both fronts. So how does this affect the overall banking industry and how does it affect the economy. The short answer is nobody knows exactly. But more than likely there will be some spillover effects as it seems reasonable that it will be more expensive for startup companies and early-stage tech companies to get financing. Typically, what causes a lot of short-term stress in the markets are all the 2nd and 3rd order effects which tend to be difficult to fully assess. How Does This Affect The Markets? We are already seeing some effects with other banks and the financial services sector in general. As I mentioned before there will be some spillover effects, but I think they will be very modest, fortunately overall the banking system is very secure. Most importantly, this event explicitly shows just how important diversification is – something Silicon Valley Bank learned the hard way. Because one company, or two companies, or even a handful of companies that fail should not hinder your portfolio from doing well over time - if you are properly diversified. As investors know, market gyrations cannot be avoided and are not a bug in the system, but rather a feature. Volatility in the market is unavoidable, while it's never pleasant or enjoyable sometimes great opportunities come from such volatility. In this case, it's advisable to look at this as the glass being half full, rather than the alternative. In real estate, when buying property, the key phrase that comes up time and time again is, Location, Location, Location. In the stock & bond market, it's Diversification, Diversification, Diversification. -Paul R. Rossi, CFA The S&P 500 Schiller CAPE Ratio, also known as the Cyclically Adjusted Price-Earnings Ratio, measures the S&P 500’s current price compared to the 10-year moving average of companies’ inflation-adjusted earnings. Invented by Yale economist Robert Shiller, the metric has become a popular measure for understanding long-term stock market valuations. A higher CAPE ratio tends to signal lower returns in the future whereas a lower CAPE ratio signals higher returns, as the ratio reverts back to its mean. “The stock market is not the economy,” but worries of a recession have been weighing heavily on investors’ minds, although the stock market is holding up pretty well. So what is the CAPE ratio saying after the S&P 500's strong start this year? The S&P 500 Shiller CAPE Ratio has a pretty strong track record of predicting market declines. Out of 21 major market declines (defined as a 10% or greater drawdown in our white paper) since 1950, the CAPE Ratio has provided warnings for 10 of them by breaching its long-term average. The chart below shows that relative peaks in the CAPE Ratio coincide with drawdowns for the S&P 500. Knowing the ratio is directly affected by declining equity prices, the question becomes: are we seeing a relative peak in valuations to start 2023? 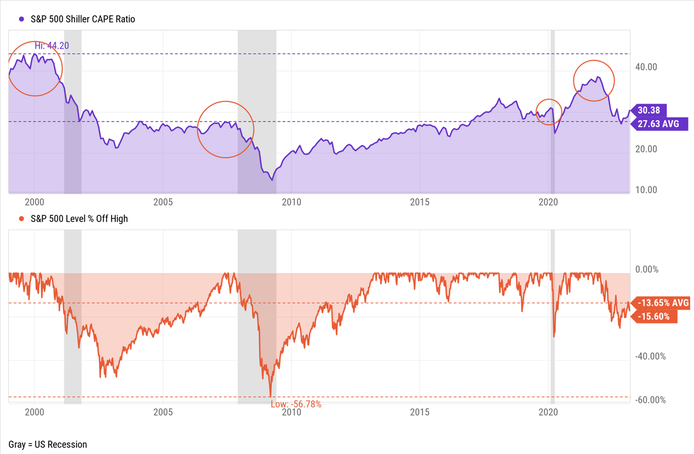 From a historical perspective, the S&P 500 is currently relatively expensive...although this is dependent on your lookback period. The CAPE Ratio reached a relative peak of 30.99 just before the pandemic selloff, then climbed to 38.58, its second-highest value ever, near the end of 2021. With stocks rallying to start 2023 the CAPE has climbed to around 30.38, meaning prices for stocks in the S&P 500 are nearly par with their February 2020 levels. But interpreting the CAPE’s relative level is not a straightforward exercise, like many things, it has to be analyzed and interpreted in context of many factors. Years ago, the well-regarded economist, John Maynard Keynes, warned, "the market can remain irrational a lot longer than you and I can remain solvent. A longer-term lookback shows the degree to which valuations (purple) have risen over recent years as the market has marched higher (red line). 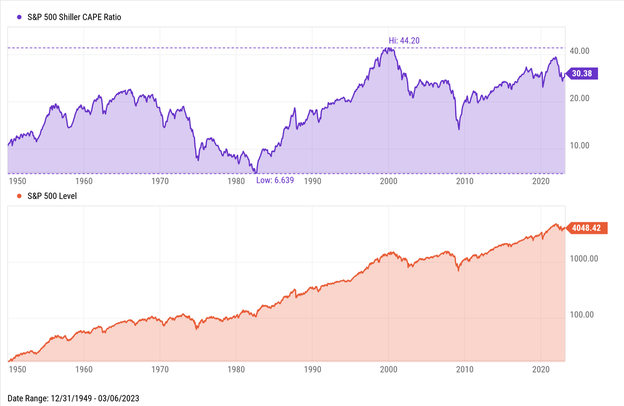 Using the CAPE along with other indicators can provide an idea where the market sits in terms of valuation and what future returns might look like. 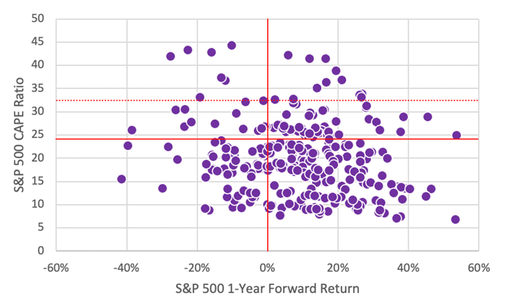 While the CAPE ratio isn't perfect in predicting crashes and short-term gyrations, as you can see from the 1-year stock market returns above vs. the starting CAPE ratio. It does do a pretty good job over the medium term, as valuations tend to mean revert over time. See the 5-year return of the market vs. the beginning CAPE ratio below. 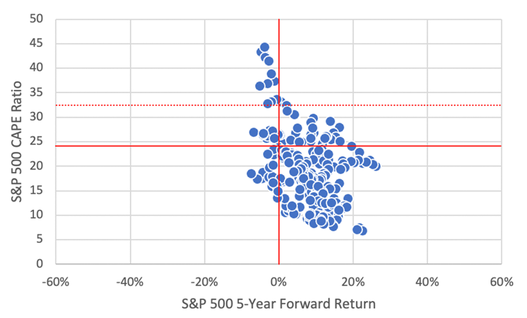
Like a good superhero, it may be well worth your time to make sure your CAPE fits before leaving the house. -Paul R. Rossi, CFA |