 I'm thankful for so many things in my life, that sometimes I feel I've won the lottery. Why do I say this? Because it's true. First, let's start with family: I have a great relationship with my wife and children that I feel very fortunate. I'll admit, I'm very intentional in how I communicate and interact with my family and don't take it for granted. While 2020 has been an extremely challenging year for so many people, I feel very fortunate because it's allowed some very positive things to come out of an extremely challenging period - and I believe many times challenging situations can provide positive growth, sometimes in truly unexpected ways. Second, my clients and friends: I never take for granted the relationships outside of my family. I have a special relationship in my clients lives as I learn what's most important to them and I get to help them achieve it. There is tremendous amount of trust that my clients must have in me, and I don't take this for granted. In addition to my clients, I have great friends that I truly appreciate. Many of these friendships span more than 25+ years with countless memorable memories. So in the spirit of Thanksgiving and being thankful, I am thankful for and would like to say thank you to my:
And this blog wouldn't be complete without a Turkey chart or two. Enjoy! 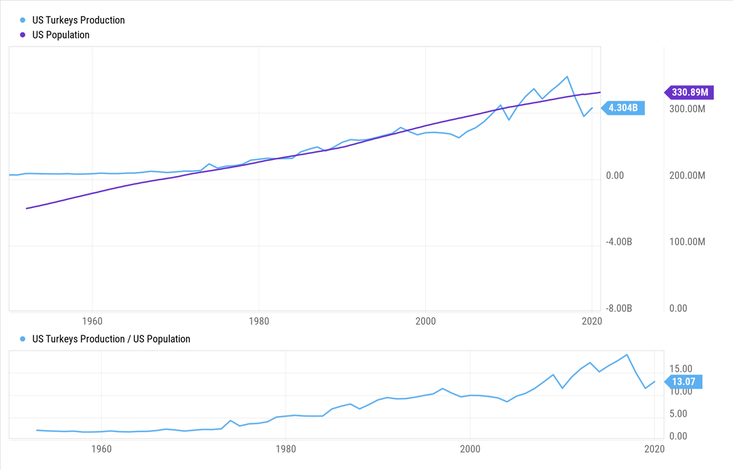 Turkey Production is out pacing US population growth! Is there an investment opportunity here? :)
-Paul R. Rossi, CFA
0 Comments
 I've heard many people over the years express their concern that investing in the stock market feels like gambling - where there is little chance of winning. The remark typically sounds something like this, “The market goes up and then it goes down and you don't make money, it feels like gambling.” So I decided to see if there is some validity to this belief. First I looked at various casino games and the odds of winning. Then I gathered stock market data from 1937 through September of 2020, using rolling periods to provide as many measurement periods as possible. Keep in mind, during this 83-year time period the market experienced 14 recessions (including our current recession) , 2 world wars, the Cuban missile crisis, the assassination of JFK, the crash of 1987, 9/11, Covid, and countless other tragic events that rocked our world. Interesting enough, after combing through the data, I can understand how people might feel this way, because over the very very short-term the stock market has had similar chances of generating positive returns as some casino games. Take a look at the chart below: Black Jack, Craps, and the 1-Day holding period for the stock market have similar probabilities of winning (historically). What also might be enlightening is the probability of "winning" in the stock market dramatically increases as the holding period increases. Over the last 83 years, the probability jumps to over 92% if an investor held for 5-years and is over 99% with a 15-year holding period. Imagine if you could play casino games and have percentages approaching anywhere near these levels. Maybe the moral of the story is what we all try to teach our children, that patience truly is a virtue. 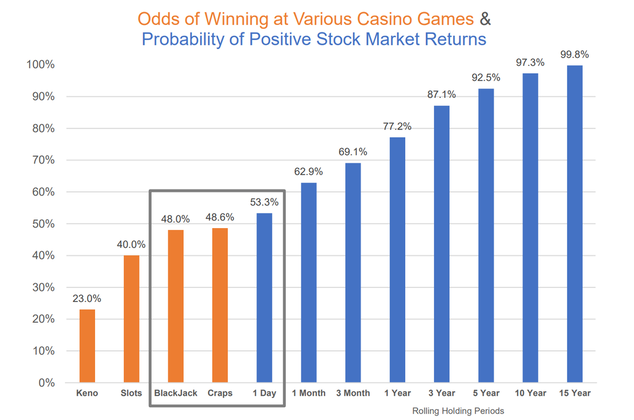 I like the long-term odds of winning in the stock market. As the Worlds Most Interesting Man might say, “Stay patient my friend.” -Paul R. Rossi, CFA  Investors with complex needs are increasingly seeking out independent advice—and one way to ensure you’re getting independent advice is to work with an independent financial advisor. Sounds pretty straight forward, if you want independent advice, then seek out firms that are independent. So what are 5 benefits of working with an independent financial advisor?
-Paul R. Rossi, CFA  In the short-term the markets trade on greed and fear, but in the medium to long-term, they trade on First Principles.
What are First Principles? Before we get to that, let us understand what greed and fear are as it relates to investing. Greed is the idea of not wanting to lose out on an opportunity to make money especially when you see others around you making what seems like easy money. As Warren Buffett said, “Long ago Sir Isaac Newton gave us three laws of motion which were the work of genius, but Sir Isaac Newton's talents didn't extend to investing: He lost a bundle in the South Sea Bubble explaining later, ‘I can calculate the movement of the stars but not the madness of men.’ If he had not been traumatized by this loss Sir Isaac might well have gone on to discover the 4th law of motion for investors as-a-whole returns decrease as motion increases.” Sir Isaac lost millions in today’s dollar equivalent by falling into the greed trap by seeing others around him making seemingly easy money on what amounted to nothing more than a house-of-cards. It didn’t end well for him. Greed is dangerous. On the other side of greed is fear. “Fear is an emotion induced by perceived danger or threat, which causes physiological changes and ultimately behavioral changes, such as fleeing, hiding, or freezing from perceived traumatic events. Fear in human beings may occur in response to a certain stimulus occurring in the present, or in anticipation or expectation of a future threat perceived as a risk to oneself. The fear response arises from the perception of danger leading to confrontation with or escape from/avoiding the threat, which in extreme cases of fear can be a freeze response or paralysis.” – Google search and definition. Interestingly enough, fear like greed can be immeasurably harmful. This can happen by taking action when doing nothing is the right thing or conversely by freezing-up and not taking action when you should. Fundamentally this comes down to rationality. The more rational you can become, the more successful as an investor you can become. How do we reduce our level of fear and strive to be more rational? By taking a step back from the situation and thinking about what’s happening and asking ourselves a series of questions.
While there are many more questions that can and should be asked prior to determining what the right course of action is, you can see that self-reflection and having a deeper understanding of the situation is paramount during times of heightened uncertainly. What is critically important is getting to a deeper understanding of the situation, what is called getting to the “First Principles”. What are First Principles? First Principles thinking is a process by which a person seeks to break down a problem to its simplest elements to find a solution. The first-principles approach has deep roots, in fact, it was a process credited to Aristotle. Over 2300 years ago, Aristotle said that a first principle is the ‘first basis from which a thing is known’ and that pursuing First Principles is the key to doing any sort of systemic inquiry. Quite simply, First Principles is the most fundamental idea which makes it the highest in importance when trying to understand a particular subject. So, what are First Principles in terms of investing? First Principles idea in investing is the understanding of ‘valuation’ and how to value an asset. Ironically, the concept is quite simple: The value of any income producing asset is the present value of its future cash flows. What does this mean? It means taking all the projected future cash flows that a company will generate in the future and discounting these cash flows to the present value using an appropriate discount rate. When you do the math, you find that the vast majority of a company’s value is wrapped up in the future years’ cash flow and not in this year or even next years’ cash flow. Click here to see an example. Investing First Principles: A company’s intrinsic value is based on its long-term cash flows that will be generated far into the future. Greed and fear will always be a part of the market. Volatility isn’t going away. What’s most important is understanding the First Principles approach to the market and realizing that individual companies and subsequently stock markets are valued on their long-term cash flow generating ability. Everything else is greed and fear. -Paul R. Rossi, CFA  Annual rebalancing can help boost returns and reduce your volatility. As 2020 wraps up, it’s time for investors to start thinking about rebalancing their portfolio(s). And while it is important to examine rebalancing every year, it can be especially important this year due to the large return differences in asset classes. For example, through early November 2020, looking at the variability of returns from different sectors and market indices is quite dramatic:
Rebalancing Matters Rebalancing is the process of buying and selling assets to move your portfolio in alignment with its original target allocation. Restoring your mix can both boost returns and lower volatility, unfortunately many investors do not understand why and how to properly execute this process. Without understanding the science of rebalancing, which is the theory behind it, average investors do not properly implement the art of rebalancing their portfolios, the actual shifting of the right assets. At best, they simply buy and hold their investments. A Basic Example of Rebalancing As a simple example, imagine two investments, A and B, which on alternate years have returns of 0% and 30% respectively. Investment A has a 30% return on odd years while B has a 30% return on even years. Over any two-year period, buying and holding either A or B will result in a 30% investment gain. At first glance, most investors would think that, in this scenario, you could not do any better than a 30% return over the two years. But an asset allocation of half in investment A and half in investment B has a total return of 32.25% for the two years. The extra 2.25% return comes from rebalancing. The portfolio had a 15% return during the first year and then is rebalanced. Half of the profits from investment A are sold and put into investment B, where they appreciate the next year and receive a compounded return. This is an example of rebalancing both reducing the volatility and boosting returns. In this example rebalancing smooths the returns to a consistent 15% each year and compounded returns adding a 2.25% bonus. Unless You Can Predict Markets Yes, it would be wonderful to invest everything in A the first year and everything in B the second year. If you had the precognition to do this, you’d earn 69%. But this type of return foresight is next to impossible. We are much more likely to chase returns than anticipate them. The worst scenario of this is investing everything in investment B the first year. Then, enticed by the returns of investment A, selling B and investing everything in A the next year. In our example, this strategy of chasing returns results in no return at all. This strategy is sadly common because people wrongly believe that an investment will continue to go up just because it went up in the past. Although some people talk about “the momentum of the markets,” the stock markets are much more complex and volatile than such simplistic strategies. The rebalancing bonus becomes clear when looking at many decades of historical data. For any one decade, one investment choice randomly has better returns and, with perfect hindsight, it appears that you should have put everything in that winner. But none of us has precognition. Instead, investing in non-correlated asset categories and then rebalancing to that asset allocation has the best chance of seeing the gains of one asset class compound in a different class the next year. There is a complex formula to compute the bonus produced by the discipline of regularly rebalancing your portfolio. The bonus is increased when the correlation between the two investments is low and the volatility of each of the assets is high, as in our simple example. The Rebalancing Bonus Consider three investments which each year have annual returns of -16%, 7%, and 30%, but rotate which year each investment has each return. If you invest equally in each and rebalance every year, you receive an average return of 7%. But if you start invested equally and don’t rebalance, your return drops to 5.33%. This is because if you don’t rebalance after a fund grows by 30%, then more money will show the -16% return in subsequent years. In the same way, not rebalancing the money that has a 16% drop means that less money receives the upcoming 30% return. When an asset class has just dropped significantly, it is difficult to sell some of the best performing class and buy more of your worst performing category. However, the greater the difference between asset class returns, the higher the rebalancing bonus. Rebalancing & Volatility The markets are inherently volatile. They experience what is called “lumpy tails,” which means there are more returns outside of the normal bell curve. The stock market’s normal volatility (about 18% standard deviation) suggests a rebalancing bonus of about 1.6%. What’s interesting, if the market were more stable, the rebalancing bonus would drop. At a 5% standard deviation for example, the bonus might only be 0.12%. This is why rebalancing only bonds does not have as much of a rebalancing bonus. The normal volatility of the bond market is only 6.9% (standard deviation), which suggests a rebalancing bonus of 0.28%. Rebalancing from stocks into bonds may reduce your returns on average since bonds have a lower average return. There are several articles suggesting that rebalancing does not boost returns, but these are about rebalancing out of stocks and into bonds. Moving into bonds may be a part of rebalancing, but the goal of such movement is not to boost returns. Bond allocations are useful to support portfolio withdrawals and limit risk. Rebalancing can increase returns because market volatility makes it difficult, if not impossible, to predict which asset class will perform well in the future. The asset that recently went down may be the next to go up, while the last to go up may be the next to go down. Thus, systematically rebalancing back to your asset allocation gives you the best chance of compounding and therefore boosting returns. As always, an important aspect to investing is knowing what you own and why.  Investing can be stressful, but it doesn’t have to be. If you have a well-built portfolio, understand what you own, and have a plan, then you shouldn’t be too worried about market volatility and what the financial pundits are saying. Here are a few tips to help you invest wisely and stay sane at the same time.
Hopefully, taking a step back from your investing life gives you greater peace of mind and lets you focus on family, friends, your personal goals and living a fulfilling life. -Paul R. Rossi, CFA  First, let's ask, what is a Registered Investment Advisor?
And what makes this advisor different from a Registered Representative who works at my bank or a national brokerage firm? - A lot actually, keep reading. A Registered Investment Advisor (RIA) is a professional independent advisory firm, that is held to the highest standard of care, the Fiduciary Standard - Registered Representatives at banks and brokerage firms are not. RIA's provide personalized financial advice to their clients, many of whom have complex financial needs. Because these advisors are independent, and are required to work in their client's best interest they are not tied to any particular family of funds or investment products, so they can use the investment that is best for the client. On the other hand, If you've ever worked with a Registered Representative from one of the large firms (Wells Fargo, Morgan Stanley, Merrill Lynch, Edward Jones, etc.) you might have noticed that many of the investments (mutual fund or ETF) in your portfolio have the same names as where the advisor works. Coincidence? Nope. Morgan Stanley makes more money if a Morgan Stanley Registered Representative uses Morgan Stanley investments in their clients portfolios - to the detriment of their clients. Most importantly, they don't have to work in your best interest. Huh, how is that you ask? Well, it's the way the Wall Streets rules have been set up. They will work in their best interest, not yours and it's completely legal, and in my mind completely wrong. To make matters even more confusing, Registered Representatives at these large firms can have titles such as Advisor, Financial Advisor, Financial Planner...but in fact, legally they are just Registered Representatives of the firms they work for. As a Independent RIA (Registered Investment Advisor) and working under the fiduciary standard, Rossi Financial Group is held to the highest standard of care—and we are required to act in the best interests of our clients at all times. Period. So what are the benefits of working with an Independent Registered Investment Advisor?
These 5 distinct benefits can make a dramatic difference in your overall financial well being. While I have a strong opinion about what type of firm you should work with, it doesn’t change the facts. So read, research, and ask a lot of questions before you enter into any financial relationship. In fact, I would require anyone you work with to sign a Fiduciary Pledge that explicitly states they will always work in your best interest. We sign one for every client. -Paul R. Rossi, CFA  Are you considered clairvoyant? Do you win an office football pool every year? Can you accurately and consistently predict 10 coin flips in a row? Are you a palm reader? Are you the sort of person who, while possessing no psychic abilities, does not mind spending hours crunching numbers and analyzing obscure data in hopes of discerning future trends? If you failed to answer yes to any of these questions, then market timing may not be for you. The belief that you, or any particularly person, can foresee the direction of the stock market is a seductive one. Some investors are confident that, with proper research, they can make money by snapping up equities when prices are low, and shifting their investments into cash or bonds when the market hits its peak. But longitudinal studies have shown that most market timers not only fail to beat the market, they may actually earn less over time than buy-and hold investors. However, many armchair investors persist in the belief that, by carefully following business news and trusting their “gut” instincts, they will be able to out-smart the market. Some study the stock tips in personal finance magazines, others hope to glean additional insight from analysts’ reports and specialized investment newsletters, and still others attempt to mine all the available data, crafting complex simulations of how the market is likely to behave in the future. But if financial professionals who do this for a living struggle to accurately predict where the stock or bond market might go, private investors are even less likely to outfox the markets. As soon as a piece of business or economic news hits the airwaves and the Internet, analysts and brokers react immediately to the information (this is call "The Efficient Market Theory" in finance). Because of financial professionals acting quickly, the market mechanics create a situation where the stock market almost always reflects all the known information at any given moment in time. And even if an individual investor were able to develop an analytic model with some real predictive value, unexpected events—such as a terrorist attack, a natural disaster, or even a political scandal—typically leads to sudden and dramatic market fluctuations that no model based on historical data could have anticipated. It is only natural that investors would want to find some way to sit out bear markets and get back just in time for the next bull run. It is useful to keep in mind, however, that even the slowest equity markets have some bright spots. A well-diversified portfolio will help you protect against loss and capture whatever gains might occur in a market downturn. Investors run a big risk by selling when they believe stocks have reached their peak. They may turn a profit when cashing in their equity holdings, but they could also miss out on some of the market’s best cycles. Being absent from the market for only a few of the days or weeks with the highest percentage gains can decimate a portfolio’s returns over time. Market timers who sell frequently also lose money to transaction costs and taxes, and miss out to a large extent on the compounding effect that benefits investors who remain in the market consistently. The vast majority of investors are better off, instead of trying to time the market, just being in the market. Of course, investors need to be in the right investments that match their risk tolerance and time horizon. Trying to pinpoint the right time to invest in the stock market is an exercise in futility. If you have a longer period to save, owning equities provides the most effective hedge against inflation and taxation available. Since it is impossible to know where the market might go from here, remember, that long-term investment success is achieved not by timing the market, but by time in the market. -Paul R. Rossi, CFA  Television and radio business news reports lead with it almost daily. Serious financial discussions begin with it. Many economic discussions are often centered on it. The “it,” is the “Dow,” or more accurately, the Dow Jones Industrial Average, and it remains the most widely used measure of stock market performance by many main street pundits. So what exactly is the Dow Jones Industrial Average? The Dow is a price weighted “average” of some of the largest and well-known companies in the United States. But how the Dow is measured, its history, and current holdings are typically not so well-known. Let's take a brief look at market history, how the Dow has changed over time, and what the current companies that make up the Dow. Charles Henry Dow first devised his market “average” in 1884. The first “Dow” average consisted of 11 stocks, nine of which were railroads--the large growth companies of that era. Not surprisingly, not one railroad company remains in the index today. The Wall Street Journal first published the Dow in 1896, covering an average of 12 stocks. During the period from 1916 to 1928, the Dow average increased to 20 stocks and then in 1928, the now familiar 30-stock Industrial Average was born. All of the original names have disappeared after GE's removal in 2018; they have either merged, changed their name, been removed from the index, or gone out of business. If we were to use an example Dow of 28,000, it would mean that the average share price of the 30 Dow stocks is $28,000, and, of course, no Dow stock sells for anything close to that level. How then, do we make sense of this “average”? Here’s how it works. The Dow average is constantly adjusted for stock splits, stock dividends, and changes in market valuations of the component stocks. As an example, when a stock splits, the share price decreases and the number of shares increases proportionally, with total value to the shareholder unchanged. For example, a stock selling for $50 per share splits two-for-one. If you owned 100 shares, you now own 200 shares worth $25 per share. Overall, nothing has changed in terms of value. You’re probably now seeing that this function is going to impact the average price because even though the price of the shares came down the value of the company remained unchanged. So, this is what creates some complexity. While the impact of stock splits on individual investor holdings is straight forward, such changes in share price have an impact on the Dow. Consider the hypothetical Dow “average” of 28,000, and, on the same day, all of the stocks split two-for-one. If no adjustments were made to allow for the split, the Dow would “drop” to 14,000 overnight without any change in the underlying value. In order to compensate for these price changes which produce no effective change in total value, the Dow average is constantly adjusted by altering the “divisor” in the pricing formula. The divisor is simply that number when divided into the total share prices of the 30 component stocks, creates an equivalent basis on which to compare a current reading with any other historical reading since 1928. Each time a split occurs, the divisor must be adjusted downward; if this did not happen, the average share price of a Dow component stock (based on a Dow of 28,000) would really be $28,000. When the 30-stock Dow average was created in 1928, the divisor was 16.67. This number was derived to establish a price relationship to earlier averages so that historical comparisons would be meaningful. Over the years, the divisor has declined steadily, falling below 1.0 in 1986, at which time it effectively became a multiplier. (A quick review of the math will show the result of dividing a number by a number less than 1.0 becomes a larger number—that is, a divisor less than 1.0 effectively becomes a multiplier). The current multiplier is 0.152. So a $1 price move in any Dow component translates to a swing of 6.58 points to the Dow. While many financial professionals use other broader measures of market activity such as Standard & Poor’s 500 Index (the S&P 500) or the Russell 2000, the Dow is still considered a reflection of the overall stock market is a testimony to how powerfully ingrained the Dow is to our collective thoughts. Below is the current list of what makes up the Dow Jones Industrial Average, along with recent market values for each company along with their respective 5-year total return. 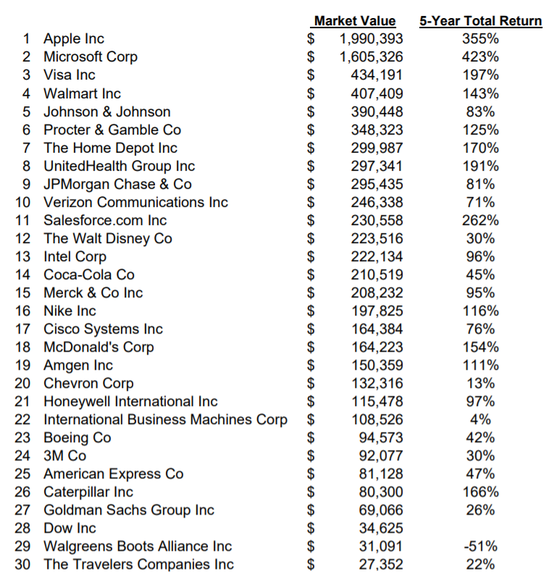 -Paul R. Rossi, CFA  The real value of a bear market may be that it gives investors, who are temporarily frozen within its grip, the opportunity to learn or relearn important lessons regarding risk and diversification. For savvy investors, a bear market also creates a period for looking beyond emotional headlines and studying the hard facts—facts that can ultimately place them in a position to take advantage of coming opportunities. Periods of falling equity prices are a natural part of investing in the stock market. Bear markets follow bull markets, and vice versa. They are considered the “ebb and flow” of wealth accumulation. Remaining Balanced Can Pay Off Bear markets create apprehension in the minds of many people. That’s natural. However, any feelings of anxiety should be balanced with reason for anyone seeking financial success. Anyone dubious about the need for a stable outlook should consider that virtually every bear market during the twentieth century was followed by a better than average annual rate of return from the bull market. Focus on Five Lessons Instead of taking a “time out” from the market, and missing out on potential opportunities, investors should focus on five key lessons the market has repeatedly been trying to teach everyone during its naturally occurring economic cycles:
Remember that you’ll be inundated with all kinds of economic information during both bear and bull markets. There will be reports (and some of them scary sounding) about inflation, interest, and unemployment figures that may entice you to either give up on the stock market or invest in it to the exclusion of investments paying relatively smaller returns. To avoid being lured to either extreme, develop a financial strategy that accounts for risks you find comfortable. Review your investments and know what you own to help ensure they are still relevant to your overall financial plan, and that you’re staying on track. Then trust yourself and stick with the plan. Also, remember that past performance does not guarantee future results. Take Advantage of Bear Markets  Over the last 152 years, from 1869 to 2020 the U.S. has experienced 31 recessions (including the current recession), for a total of 43.8 years of economic contraction. And on average each recession lasted 17 months. Conversely, there have been 32 periods of expansion economic activity totaling over 108.2 years, with each one averaging 3.3 years. So, said another way, 71% of the time we are in an expansive economy and 29% we are in a contracting economy. What is surprising, of these 31 recessions, 54% (17) of the time, the stock market actually went up. How is this possible? Because the stock market is not the economy. No one predicted this pandemic, it's impact on our economy, and the stock market's response over the last 6 months. The economy is down, the stock market is up. The world is complicated. U.S. stock market peaks and troughs are often independent of the beginning and ending of recessions. In fact, the U.S. stock market many times peaks six months before the start of a recession. The correlation between U.S. stock market returns and GDP over the 31 recessions is -0.1. What does this mean? Correlation calculations and results can fall between -1.0 and +1.0. A correlation of +1.0 means two variables move in lock-step with each other, while a correlation of -1.0 means they move exactly opposite of each other. If one was up the other is down. Typically, a number between -0.3 and +0.3 can be understood to mean the two variables are not correlated with each other and basically move independent of one another. What also might be surprising, the market tends to recover quickly, returning on average 23.5% in the 12-months following the end of a recession. As Warren Buffett has said, “Be fearful when others are greedy and be greedy when others are fearful.” An idea to keep in mind during the next recession and market downturn. Many times these downturns provide opportunities to purchase at a discount to intrinsic value. It is difficult to time recessions, even more difficult to time the stock market. Making predictions is easy...making accurate predictions is impossible. The Stock Market is not the Economy. 
Investing principles to provide you comfort during exuberant markets.
Your biggest question: How do you keep your head during what is an unprecedented time. It might seem the stock market and the economy are not reading the same news. There’s an effective medium, though, between doing nothing and panicky trading. These guidelines can keep you level-headed even while the markets twist and turn and record new highs. Revisit your ISP (Investment Policy Statement) and if you don't have one, now is the time to put one together. An IPS is a written planning document that describes your investment objectives and risk tolerance over a relevant time horizon, along with the constraints that apply to your portfolio. An IPS serves as your guardrail so you don’t veer all over, chasing investments or changing your strategy as markets ebb and flow. This document should be designed, built, and discussed prior to constructing and implementing your investment portfolio. The IPS creates a link between your unique considerations and your strategic asset allocation. The IPS is also an operating manual, listing key ongoing management responsibilities. You and your financial advisor should review the IPS regularly and update it whenever changes occur either if your circumstances change or the capital markets environment changes. Your ISP should include the following:
A well-constructed IPS has several powerful advantages. One advantage is that the IPS encourages investment discipline and reinforces your commitment to follow the strategy. This advantage is particularly important during adverse market conditions, like we've just experienced recently. A second advantage is that the IPS focuses on long-term goals rather than short-term performance. Third, the IPS provides evidence of a professional, client-focused well thought-out investment management process, with the fulfillment of fiduciary responsibilities. By having an IPS you’ll know what to do and exactly when to do it – not just when your emotions want to move you. Exxon Mobile has been a part of the part of the Dow Jones Industrial Average in one form or another since 1928. It's one of the largest oil companies in the world and for 92 years was considered a stalwart. In 1994 Exxon was valued at over $446 billion dollars and was the most valuable company in the United States. At one point, even Warren Buffett owned the stock. From 1994 - 2013 Exxon generated an annualized return of 12.65%, a whopping total return of 985% return during this 20-year period. Exxon's performance completely dwarfed the overall stock markets total return of 471%. What could go wrong? 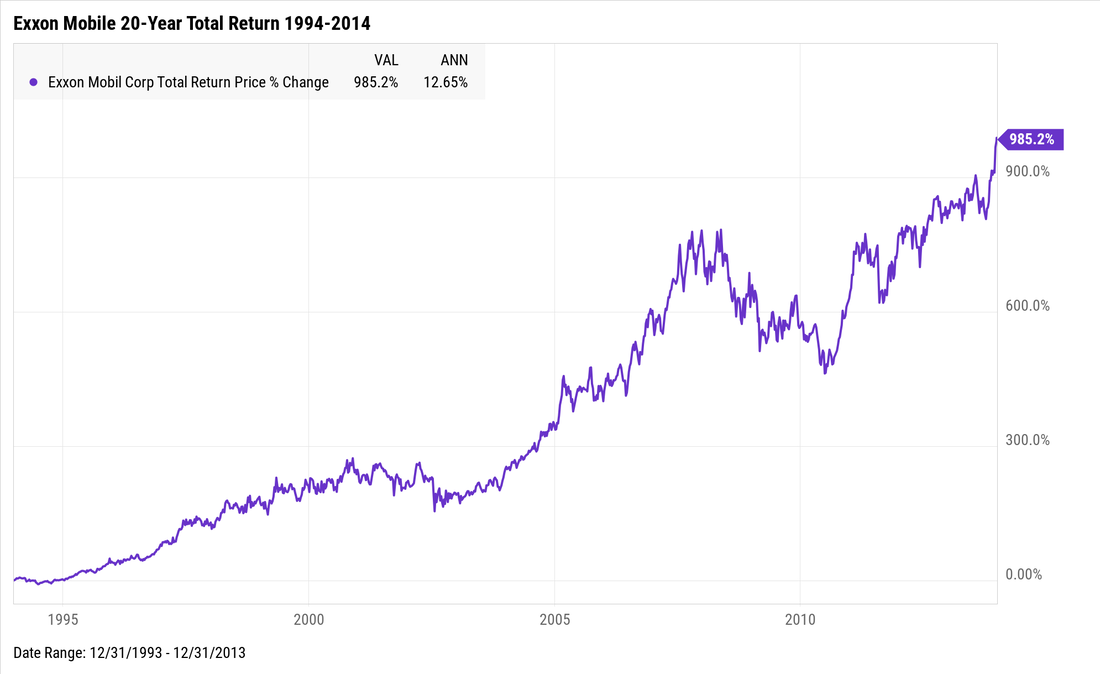 Well, as most of us have come to learn, nothing is guaranteed in this world, and this definitely holds true on Wall Street. The challenge for Exxon and one reason why the company is being removed from the Dow Jones Industrial Average today, actually began back in 2014. From Exxon's high in 2014, it's seen it's stock drop by -46%. Several years ago, the energy sector made up 16% of the S&P 500, today it makes up less than 3%. What does this mean? This means that the Energy sector and Exxon is not as an important part of the market as it used to be. The once mighty and most valuable company in the United States, Exxon is now worth just 8.5% of Apple or about 10% of Amazon. 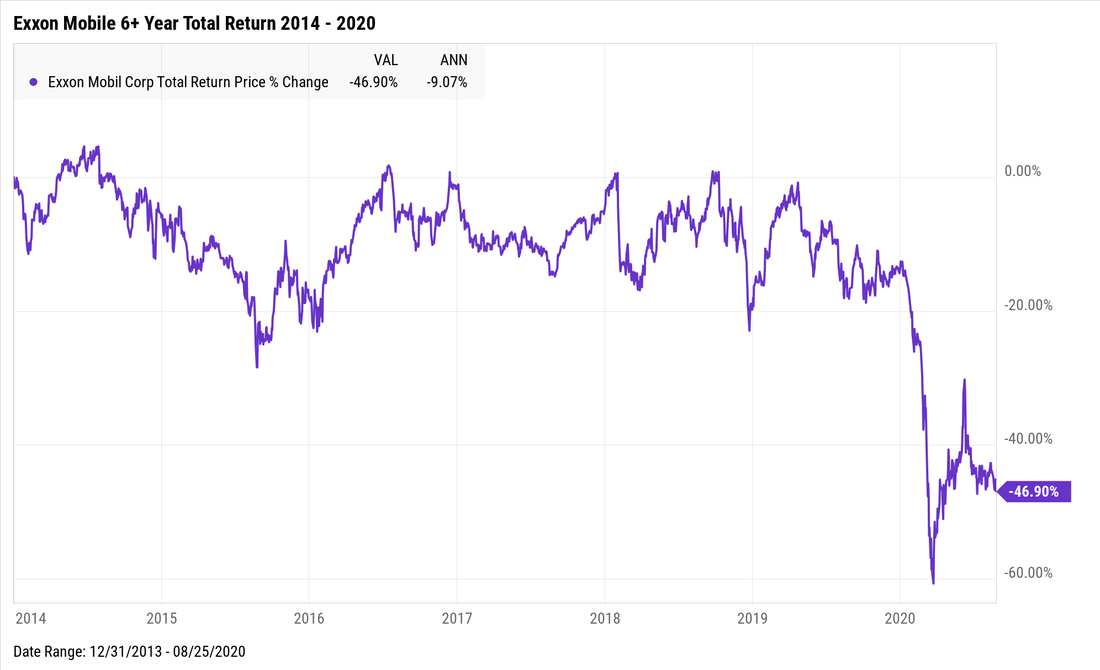 Why did Exxon's mobile stock price drop by -46% over a period the time when the stock market is up 111% and so many technology company's stock prices have been soaring? As I've written before, a company's stock price is a reflection of it's earnings and it's future growth prospects. The market cares little about the past. And on this front, Exxon falls flat. Both it's earnings (see below) and it's future growth prospects do not look promising. Since 2014 Exxon's earnings per share are down a staggering -77%. And digging into the company's financial statements, the numbers do not look good, whether looking at their revenue, earnings, or the the company's balance sheet. 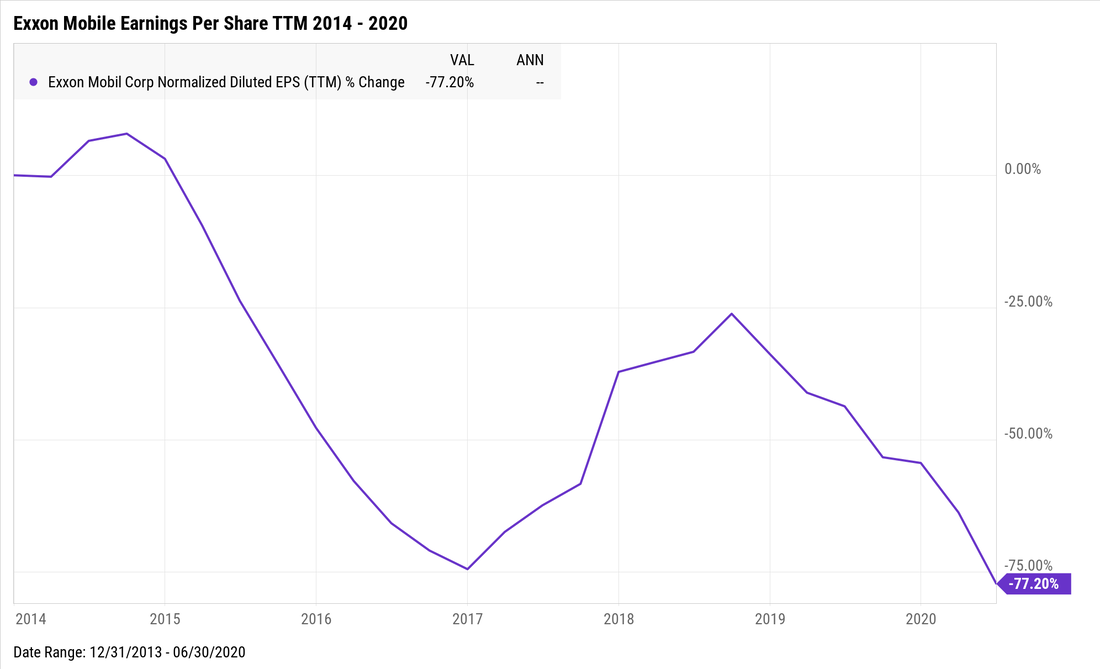 While I'm not predicting Exxon's emanant demise or that it will not survive, I think Exxon will do just fine. However, its future doesn't look as bright as its storied past.
What can we take from this? Well, several ideas can be drawn from Exxon being dropped from the Dow Jones Industrial Average.
 As we get closer to the US Presidential election, the chatter begins to build about who may or may not occupy the White House, which in turn leads investors to worry about how this might impact the stock market. I’d like to provide some information and historical perspective. For years now, politics and investing have been spoken about in the same breath. Market pundits and even presidents themselves have linked the performance of the stock market as a sort of “barometer” of their administration’s policies. What's interesting, the data doesn’t support this connection. Over the past 100+ years, the long-term performance of the market has shown almost no correlation with government policies. Informed investors realize that the key drivers of stock market performance have been, and will continue to be, earnings and economic growth. Much of our collective memory about the performance of the economy under various past presidents’ stems from incorrect historical narratives, not hard data. Presidential Stock Market Returns vs. Economic Growth (1957 - present) 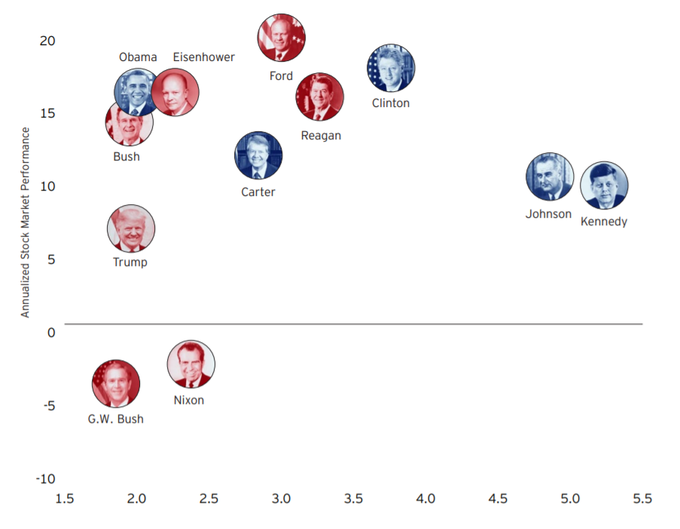 While we want to believe that this election season will be different than so many previous elections, it won't be. There will be vitriol on both sides. It will be a knock-down drag out fight, and it will not be pretty. But…the good news is, in spite of this, history has shown that investors have prospered even during the most difficult political times. In fact they done extremely well during all sorts of challenging times. There has never been a time when there was not something to be concerned about, whether it be, up-coming elections, trade-wars, inflation, social unrest, military wars, or anything else that grabs the medias' attention. Several years ago, Invesco, a provider of financial products, coined a phrase that bears repeating: “Hating the government is not an investment strategy.” We agree. While nobody can say with absolute certainty who will win in November 2020, we can say for most people staying the course has made the most sense for long-term investment success. Here are some certainties during this uncertain election season. 6 Ideas to Keep in Mind No Matter Who Wins:
Many people attempt to use historical narratives to inform ourselves about the future, but do we get the history right?
The charts below show a metric for each president, in dark blue, compared with the long-term average growth rate for that metric since the end of World War II. Clearly, history is often remembered differently than the actual data. And you thought calculus was hard. 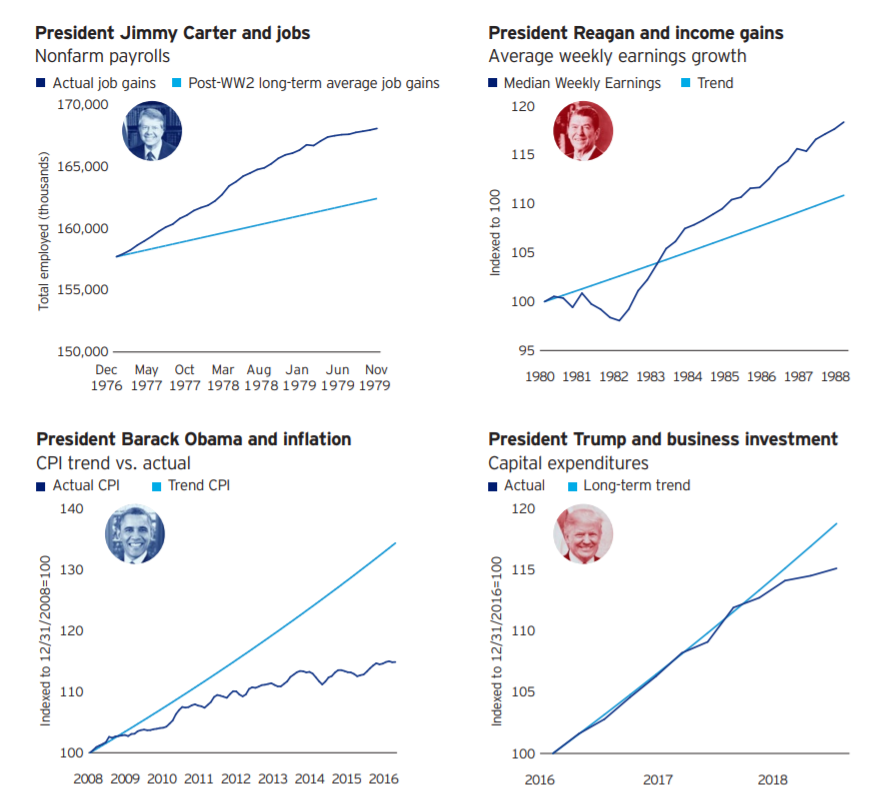 How about only investing when your particular party controls the Presidency? “Partisan” portfolios – which would invest only when a Democrat or a Republican was in office – significantly underperformed the “bipartisan” portfolio that stayed invested regardless of who was in power. The difference is a result of the fact that the US stock market rose fairly consistently over the past 120 years, even while enduring two world wars, many smaller wars, two major financial crises, several recessions, and now, not one, but two pandemics. The best-performing portfolio over the past 120 years was one that stayed fully invested through both Democratic and Republican administrations. The more time in market, and not trying to time the market, the better investors have done. See below. 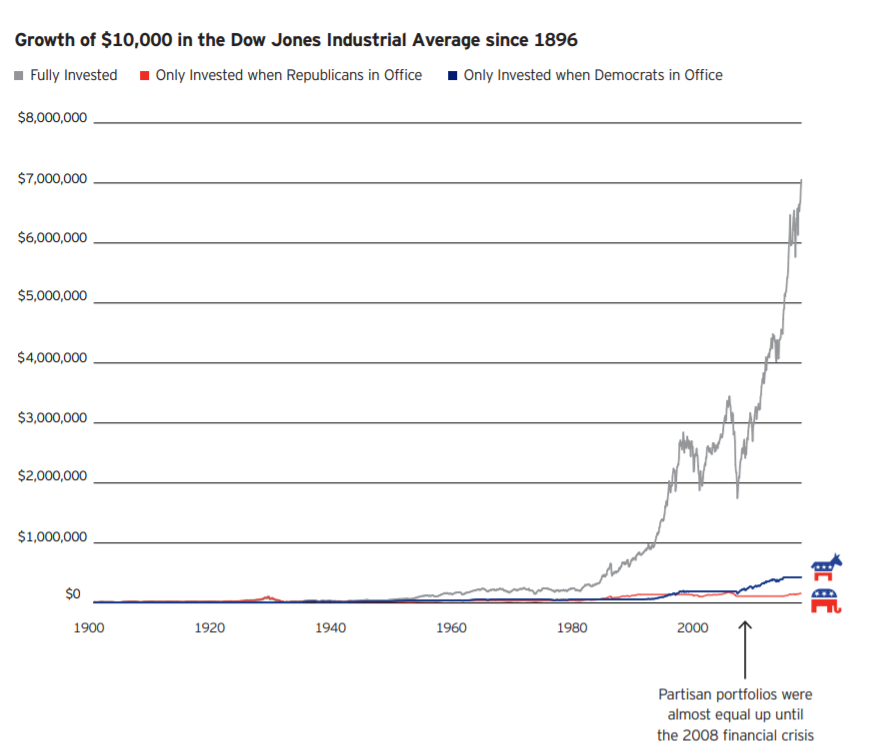 So what does all this mean?
It means if you have a well-designed investment portfolio, you can stop worrying about who's going to win the Presidential election and focus on what you can control and what I would argue is most important. Things like, the relationship with your family & friends, your health, the people you can positively impact, and your long-term goals. Charts and data from Invesco. by Carlo M. Cipolla (professor of Economics 1922-2000) The First Law of Human Stupidity The first basic law of human stupidity asserts without ambiguity that:
At first, the statement sounds trivial, vague and horribly ungenerous. Closer scrutiny will however reveal its realistic veracity. No matter how high are one's estimates of human stupidity, one is repeatedly and recurrently startled by the fact that: a) people whom one had once judged rational and intelligent turn out to be unashamedly stupid. b) day after day, with unceasing monotony, one is harassed in one's activities by stupid individuals who appear suddenly and unexpectedly in the most inconvenient places and at the most improbable moments. The First Basic Law prevents me from attributing a specific numerical value to the fraction of stupid people within the total population: any numerical estimate would turn out to be an underestimate. Thus in the following pages I will denote the fraction of stupid people within a population by the symbol σ. The Second Basic Law This fact is scientifically expressed by the Second Basic Law which states that:
Cultural trends now fashionable in the West favor an egalitarian approach to life. People like to think of human beings as the output of a perfectly engineered mass production machine. Geneticists and sociologists especially go out of their way to prove, with an impressive apparatus of scientific data and formulations that all men are naturally equal and if some are more equal than others, this is attributable to nurture and not to nature. I take an exception to this general view. It is my firm conviction, supported by years of observation and experimentation, that men are not equal, that some are stupid and others are not, and that the difference is determined by nature and not by cultural forces or factors. One is stupid in the same way one is red-haired; one belongs to the stupid set as one belongs to a blood group. A stupid man is born a stupid man by an act of Providence. Although convinced that fraction of human beings are stupid and that they are so because of genetic traits, I am not a reactionary trying to reintroduce surreptitiously class or race discrimination. I firmly believe that stupidity is an indiscriminate privilege of all human groups and is uniformly distributed according to a constant proportion. In this regard, Nature seems indeed to have outdone herself. It is well known that Nature manages, rather mysteriously, to keep constant the relative frequency of certain natural phenomena. For instance, whether men proliferate at the Northern Pole or at the Equator, whether the matching couples are developed or underdeveloped, whether they are black, red, white or yellow the female to male ratio among the newly born is a constant, with a very slight prevalence of males. We do not know how Nature achieves this remarkable result but we know that in order to achieve it Nature must operate with large numbers. The most remarkable fact about the frequency of stupidity is that Nature succeeds in making this frequency equal to the probability quite independently from the size of the group. Thus one finds the same percentage of stupid people whether one is considering very large groups or one is dealing with very small ones. No other set of observable phenomena offers such striking proof of the powers of Nature. The evidence that education has nothing to do with the probability was provided by experiments carried on in a large number of universities all over the world. One may distinguish the composite population which constitutes a university in five major groups, namely the blue-collar workers, the white-collar employees, the students, the administrators and the professors. Whenever I analyzed the blue-collar workers I found that the fraction σ of them were stupid. As σ's value was higher than I expected (First Law), paying my tribute to fashion I thought at first that segregation, poverty, lack of education were to be blamed. But moving up the social ladder I found that the same ratio was prevalent among the white-collar employees and among the students. More impressive still were the results among the professors. Whether I considered a large university or a small college, a famous institution or an obscure one, I found that the same fraction σ of the professors are stupid. So bewildered was I by the results, that I made a special point to extend my research to a specially selected group, to a real elite, the Nobel laureates. The result confirmed Nature's supreme powers: σ fraction of the Nobel laureates are stupid. This idea was hard to accept and digest but too many experimental results proved its fundamental veracity. The Second Basic Law is an iron law, and it does not admit exceptions. The Women's Liberation Movement will support the Second Basic Law as it shows that stupid individuals are proportionately as numerous among men as among women. The underdeveloped of the Third World will probably take solace at the Second Basic Law as they can find in it the proof that after all the developed are not so developed. Whether the Second Basic Law is liked or not, however, its implications are frightening: the Law implies that whether you move in distinguished circles or you take refuge among the head-hunters of Polynesia, whether you lock yourself into a monastery or decide to spend the rest of your life in the company of beautiful and lascivious women, you always have to face the same percentage of stupid people - which percentage (in accordance with the First Law) will always surpass your expectations. The Third (and Golden) Basic Law As the Third Basic Law explicitly clarifies:
The Third Basic Law assumes, although it does not state it explicitly, that human beings fall into four basic categories: the helpless, the intelligent, the bandit and the stupid. It will be easily recognized by the perspicacious reader that these four categories correspond to the four areas I, H, S, B, of the basic graph (see below). 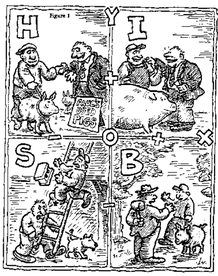 If Tom takes an action and suffers a loss while producing a gain to Dick, Tom's mark will fall in field H: Tom acted helplessly. If Tom takes an action by which he makes a gain while yielding a gain also to Dick, Tom's mark will fall in area I: Tom acted intelligently. If Tom takes an action by which he makes a gain causing Dick a loss, Tom's mark will fall in area B: Tom acted as a bandit. Stupidity is related to area S and to all positions on axis Y below point O. When confronted for the first time with the Third Basic Law, rational people instinctively react with feelings of skepticism and incredulity. The fact is that reasonable people have difficulty in conceiving and understanding unreasonable behavior. But let us abandon the lofty plane of theory and let us look pragmatically at our daily life. We all recollect occasions in which a fellow took an action which resulted in his gain and our loss: we had to deal with a bandit. We also recollect cases in which a fellow took an action which resulted in his loss and our gain: we had to deal with a helpless person. We can recollect cases in which a fellow took an action by which both parties gained: he was intelligent. Such cases do indeed occur. But upon thoughtful reflection you must admit that these are not the events which punctuate most frequently our daily life. Our daily life is mostly, made of cases in which we lose money and/or time and/or energy and/or appetite, cheerfulness and good health because of the improbable action of some preposterous creature who has nothing to gain and indeed gains nothing from causing us embarrassment, difficulties or harm. Nobody knows, understands or can possibly explain why that preposterous creature does what he does. In fact there is no explanation - or better there is only one explanation: the person in question is stupid. Frequency Distribution Most people do not act consistently. Under certain circumstances a given person acts intelligently and under different circumstances the same person will act helplessly. The only important exception to the rule is represented by the stupid people who normally show a strong proclivity toward perfect consistency in all fields of human endeavors. From all that proceeds, it does not follow, that we can chart on the basic graph only stupid individuals. We can calculate for each person his weighted average position in the plane of figure 1 quite independently from his degree of inconsistency. A helpless person may occasionally behave intelligently and on occasion he may perform a bandit's action. But since the person in question is fundamentally helpless most of his action will have the characteristics of helplessness. Thus the overall weighted average position of all the actions of such a person will place him in the H quadrant of the basic graph. The fact that it is possible to place on the graph individuals instead of their actions allows some digression about the frequency of the bandit and stupid types. The perfect bandit is one who, with his actions, causes to other individuals losses equal to his gains. The crudest type of banditry is theft. A person who robs you of 100 pounds without causing you an extra loss or harm is a perfect bandit: you lose 100 pounds, he gains 100 pounds. The frequency distribution of the stupid people is totally different from that of the bandit. While bandits are mostly scattered over an area stupid people are heavily concentrated. The reason for this is that by far the majority of stupid people are basically and unwaveringly stupid - in other words they perseveringly insist in causing harm and losses to other people without deriving any gain, whether positive or negative. There are however people who by their improbable actions not only cause damages to other people but in addition hurt themselves. They are a sort of super-stupid. The Power of Stupidity It is not difficult to understand how social, political and institutional power enhances the damaging potential of a stupid person. But one still has to explain and understand what essentially it is that makes a stupid person dangerous to other people - in other words what constitutes the power of stupidity. Essentially stupid people are dangerous and damaging because reasonable people find it difficult to imagine and understand unreasonable behavior. An intelligent person may understand the logic of a bandit. The bandit's actions follow a pattern of rationality: nasty rationality, if you like, but still rationality. The bandit wants a plus on his account. Since he is not intelligent enough to devise ways of obtaining the plus as well as providing you with a plus, he will produce his plus by causing a minus to appear on your account. All this is bad, but it is rational and if you are rational you can predict it. You can foresee a bandit's actions, his nasty maneuvers and ugly aspirations and often can build up your defenses. With a stupid person all this is absolutely impossible as explained by the Third Basic Law. A stupid creature will harass you for no reason, for no advantage, without any plan or scheme and at the most improbable times and places. You have no rational way of telling if and when and how and why the stupid creature attacks. When confronted with a stupid individual you are completely at his mercy. Because the stupid person's actions do not conform to the rules of rationality, it follows that: a) one is generally caught by surprise by the attack; b) even when one becomes aware of the attack, one cannot organize a rational defense, because the attack itself lacks any rational structure. The fact that the activity and movements of a stupid creature are absolutely erratic and irrational not only makes defense problematic but it also makes any counter-attack extremely difficult - like trying to shoot at an object which is capable of the most improbable and unimaginable movements. The Fourth Basic Law This is clearly summarized in the Fourth Basic Law which states that:
That helpless people, namely those who in our accounting system fall into the H area, do not normally recognize how dangerous stupid people are, is not at all surprising. Their failure is just another expression of their helplessness. The truly amazing fact, however, is that also intelligent people and bandits often fail to recognize the power to damage inherent in stupidity. It is extremely difficult to explain why this should happen and one can only remark that when confronted with stupid individuals often intelligent men as well as bandits make the mistake of indulging in feelings of self-complacency and contemptuousness instead of immediately secreting adequate quantities of adrenaline and building up defenses. One is tempted to believe that a stupid man will only do harm to himself but this is confusing stupidity with helplessness. On occasion one is tempted to associate oneself with a stupid individual in order to use him for one's own schemes. Such a maneuver cannot but have disastrous effects because: a) it is based on a complete misunderstanding of the essential nature of stupidity and b) it gives the stupid person added scope for the exercise of his gifts. One may hope to outmaneuver the stupid and, up to a point, one may actually do so. But because of the erratic behavior of the stupid, one cannot foresee all the stupid's actions and reactions and before long one will be pulverized by the unpredictable moves of the stupid partner. Through centuries and millennia, in public as in private life, countless individuals have failed to take account of the Fourth Basic Law and the failure has caused mankind incalculable losses. The Fifth Basic Law The Fifth Basic Law states that:
Instead of considering the welfare of the individual let us consider the welfare of the society, regarded in this context as the algebraic sum of the individual conditions. A full understanding of the Fifth Basic Law is essential to the analysis. It may be parenthetically added here that of the Five Basic Laws, the Fifth is certainly the best known and its corollary is quoted very frequently. The corollary of the Law is that: A stupid person is more dangerous than a bandit. The result of the action of a bandit is purely and simply a transfer of wealth and/or welfare. After the action of a bandit, the bandit has a plus on his account which plus is exactly equivalent to the minus he has caused to another person. The society as a whole is neither better nor worse off. If all members of a society were perfect bandits the society would remain stagnant but there would be no major disaster. The whole business would amount to massive transfers of wealth and welfare in favor of those who would take action. If all members of the society would take action in regular turns, not only the society as a whole but also individuals would find themselves in a perfectly steady state of no change. When stupid people are at work, the story is totally different. Stupid people cause losses to other people with no counterpart of gains on their own account. Thus the society as a whole is impoverished. The system of accounting which finds expression in the basic graphs shows that while all actions of individuals add to the welfare of a society; although in different degrees. In other words the helpless with overtones of intelligence, the bandits with overtones of intelligence and above all the intelligent all contribute, though in different degrees, to accrue to the welfare of a society. On the other hand the bandits with overtones of stupidity and the helpless with overtones of stupidity manage to add losses to those caused by stupid people thus enhancing the nefarious destructive power of the latter group. All this suggests some reflection on the performance of societies. According to the Second Basic Law, the fraction of stupid people is a constant σ which is not affected by time, space, race, class or any other sociocultural or historical variable. It would be a profound mistake to believe the number of stupid people in a declining society is greater than in a developing society. Both such societies are plagued by the same percentage of stupid people. The difference between the two societies is that in the society which performs poorly: a) the stupid members of the society are allowed by the other members to become more active and take more actions; b) there is a change in the composition of the non-stupid section with a relative decline of populations. This theoretical presumption is abundantly confirmed by an exhaustive analysis of historical cases. In fact the historical analysis allows us to reformulate the theoretical conclusions in a more factual way and with more realistic detail. Whether one considers classical, or medieval, or modern or contemporary times one is impressed by the fact that any country moving uphill has its unavoidable σ fraction of stupid people. However the country moving uphill also has an unusually high fraction of intelligent people who manage to keep the σ fraction at bay and at the same time produce enough gains for themselves and the other members of the community to make progress a certainty. In a country which is moving downhill, the fraction of stupid people is still equal to σ; however in the remaining population one notices among those in power an alarming proliferation of the bandits with overtones of stupidity and among those not in power an equally alarming growth in the number of helpless individuals. Such change in the composition of the non-stupid population inevitably strengthens the destructive power of the σ fraction and makes decline a certainty. And the country goes to Hell.  Me and my youngest son on the beach in Carmel, CAMany people would like to leave a legacy to the children or grandchildren but aren't quite sure how to do it, they don't know the best way to go about doing it, or might not have a substantial amount of money set aside to be able to feel like they can make an impact.
There is a novel solution we've come up with that provides several key benefits:
So what is this strategy? Custodial Roth IRA Account Let's break down what this account actually is. "Custodial" means it's an account for a minor. So when the minor turns 18 (or the age of consent in your state), the account automatically becomes theirs and they have complete control of the account. Up until that point, the person who set up the account controls it. And now the last part of the name, the "Roth IRA" is just like a regular Roth IRA which allows up to $6,000 to be contributed into the account on a yearly basis (as of 2020). The money goes into the account after tax, grows tax deferred, and comes out tax free. A Win/Win. So why is this such a great strategy? Let's use an example to show case some of the many benefits and power of using this type of account for a minor. Let's say your 13 year daughter or son has a part-time job and has what the IRS calls "Earned Income," with Earned Income, they or you can contribute up to 100% of their Earned Income that year into a Custodial Roth IRA Account. The part-time job could be from baby-sitting, mowing lawns, painting, office work, etc. The contribution into the Custodial Roth IRA Account must be equal or less than your child's Earned Income in that year and if your child earned less than $12,000 no tax return is required to be filed. That's always a Win. So back to our example: let's say your 13 year old child makes $2,000 per year from age 13 through age 17 (5 years) for a total of $10,000. You as a parent, or even a grandparent, can contribute that same amount into a Custodial Roth IRA Account you set up for them each year ($2,000 per year for 5 years) for a total of $10,000. * Of course they can contribute quite a bit more than $10,000 over this period, but to keep the example simple, we chose $10,000. And so here's where it gets exciting. Because you/they are starting to save and invest at such a young age the power of compounding becomes unbelievably powerful. Assuming they have $10,000 in their account at age 18 and invest the money for long-term growth, it's not completely unreasonable that the account could grow at an annualized rate of 10% (the stock market historical average). If they didn't touch this money until they retired at age 65 (which is what this was intended for), the $10,000 would grow to $1,078,266. And not only this but there will be no taxes due ever. So when your child/grandchild retires, the money they pull out will not be taxed! This is a triple Win/Win/Win. Now imagine what the account value might become if your child/grandchild started contributing to this same account when they started working. With a modest savings of just $200 a month, the account could be worth several million dollars ($3M+) by the time they retire. Imagine the piece of mind you and your child/grandchild will feel knowing their financial future is secure - all by the age of 18. This is also a great way to teach and have fun conversations about saving, investing, analyzing companies, the economy, etc., over the course of a lifetime with your family. Engaging your children/grandchildren in the process will pay huge dividends on so many levels. Now go open up a Custodial Roth IRA. Do it now. If you need help, send an email or drop us a line and we can discuss this and other strategies to help you and your family build wealth. Stock markets around the world rallied in the second quarter of 2020, recouping much of the ground lost in the first quarter of the year as the Coronavirus pandemic shook the overall economy and dominated headlines. The tech dominated Nasdaq Composite Index returned to all-time high territory in June while the S&P 500 and Dow 30 ended the quarter 7% and 11% off previous highs respectively. The strong stock market amidst all the uncertainty in the economy has been a head-scratcher for many. Below we’ll look at the performance of different sectors, several asset classes, some leading and lagging economic indicators, and some of the government policy that has been implemented – all of which may help to shed some light on these confusing times. The stock market has mostly reinforced a few of the guiding principals we should all remember: markets are not predictable in the short term, stock prices are driven purely by supply and demand, and while markets are influenced by the broader economy they are not directly linked. 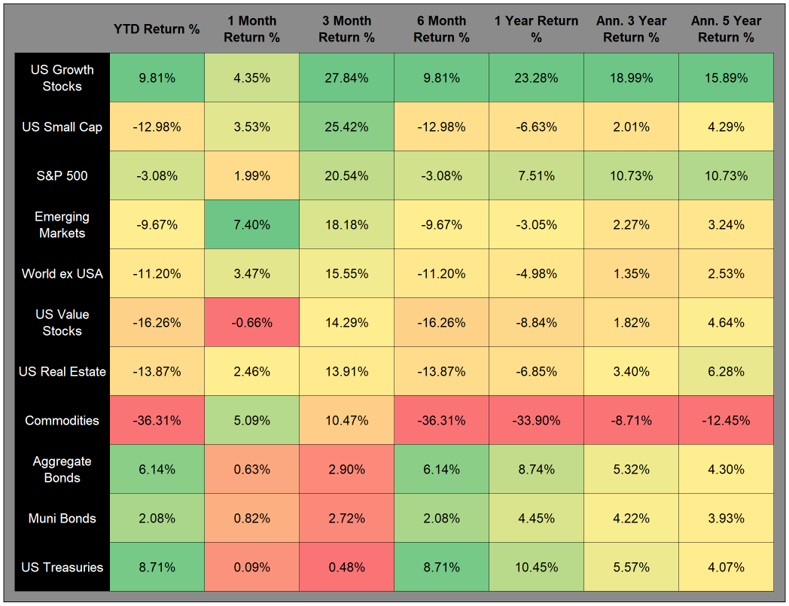 When we looked at asset class performance in the first quarter of 2020, exposure to treasuries and other bonds was a big focus. Fixed income was protecting downside and providing returns with negative correlation to stock market results, reducing overall portfolio risk. In the second quarter higher risk assets made a comeback and bonds lagged. Commodities and real estate gained back some of the ground lost in the first quarter but still have largely negative returns year-to-date. Value stocks continued to underperform those in growth indices while small caps edged out larger companies. The volatile markets of 2020 seem to be benefitting the assets on the far ends of the risk spectrum more so than those considered moderate. With more volatility likely due to uncertain macro events, remaining diversified looks to be a wise decision. 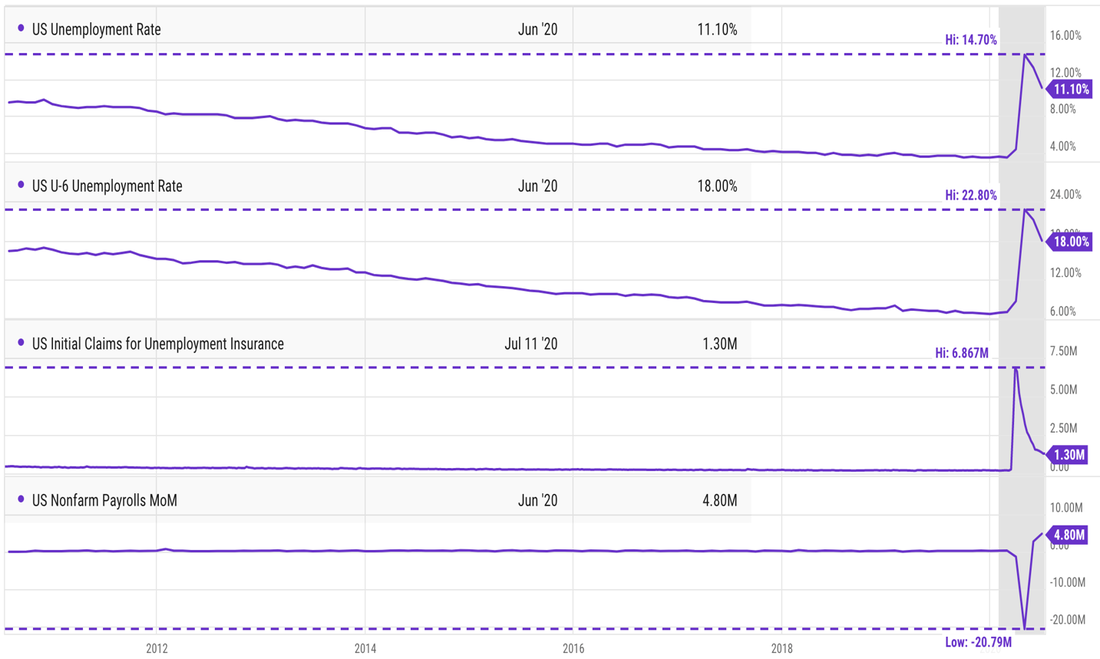 2020 has proven to be a year of extremely volatile employment data. We’ve seen swings of unprecedented values as record numbers of workers applied for unemployment insurance and subsequently returned back to work at some capacity. The U-6 data on this chart includes “under-employed” persons as well as unemployed indicating that a large number of people are working but earning less than they would at full employment. While initial claims are much lower than they were a few months ago, we’ve still seen 17 straight weeks with more than 1 million people filing for benefits. With the extended unemployment benefit scheduled to cease soon, it will be a number we’re keeping an eye on each week. 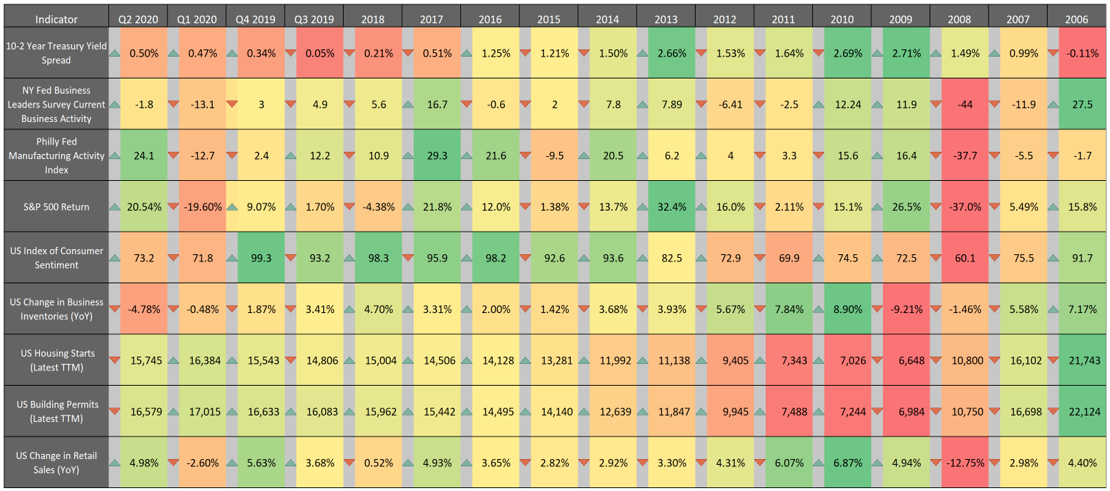 Most leading indicators moved in a positive direction based on the data released in the last 3 months. Manufacturing saw an impressively big uptick after a few months of slumping activity. Housing data showed some modest declines, but mostly due to upward revisions on past data. Retail sales and consumer sentiment both moved in the right direction, but the latter is still significantly lower than highs from pre-recession times. 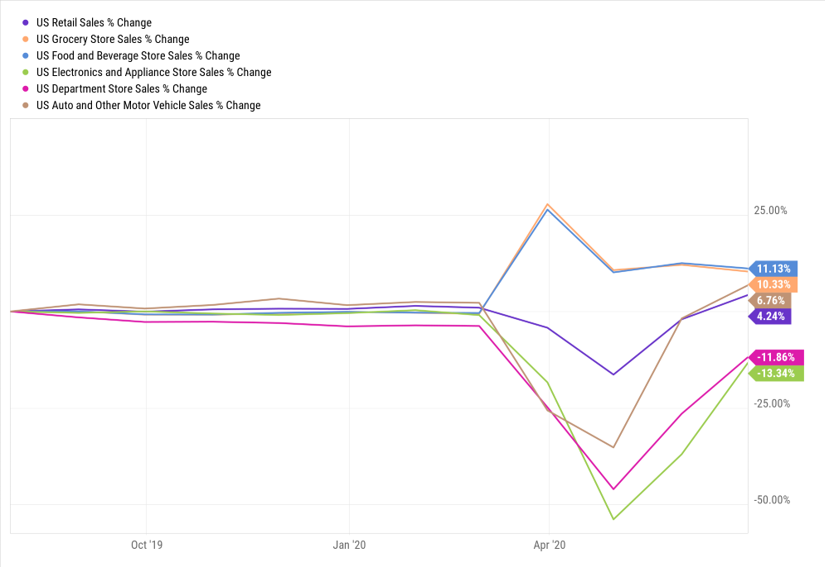 A closer look at retail sales data indicates that spending patterns are returning to normal. At the height of the COVID recession we saw spending on food and groceries jump while all other types of spending declined sharply. These trends seem to be trending back to usual levels now in both regards. 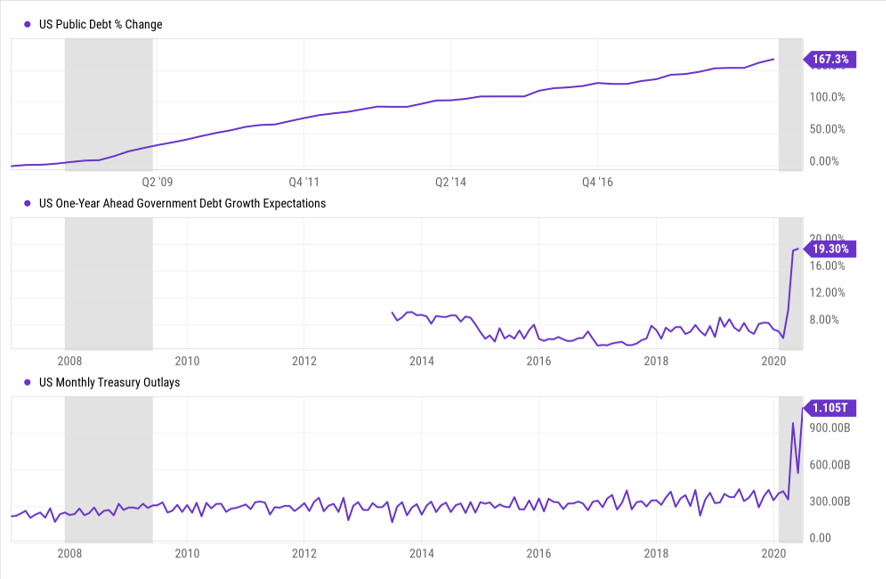 It’s been a time of record stimulus and spending as the US Government has been looking for ways to minimize the impact of coronavirus shutdowns on businesses and the American people. We’ve yet to see the data released on the total US public debt but expectations are that it will grow by a whopping 19% over the next 12 months. Treasury outlays have also been significantly higher than ever before, dwarfing anything from the 2008 financial crisis recession. 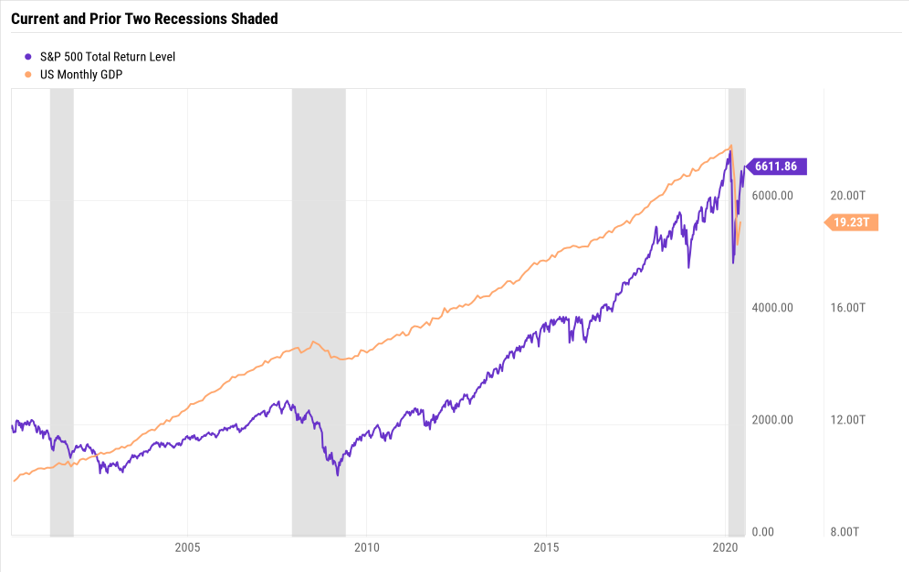 Here we have a chart showing stock market values and GDP over the current recession so far as well as the past two recessions (in grey). The magnitudes of movements in both this time around are apparent from looking at this chart. The “V” shaped recovery that seems to be taking place in the stock market is yet to be seen from a GDP perspective.
In summary the stock market has mostly reinforced a few of the guiding principals we should all remember: markets and the economy are not predictable in the short term, and having a well thought out financial plan is critical to your long-term financial health.  What does it take for someone to put their capital at risk and entrust their funds to someone else to manage?
Trust is a multi-layered concept, and it is essential to the proper functioning of capital markets. Without it, financial interactions would become more inefficient and costly or cease altogether. In this fourth edition of the CFA Institute investor trust study, we examine how trust in the industry has evolved, while the essential characteristics of trust endure. CFA Institute began studying investor trust in 2013. The purpose of this study, the fourth in the series on trust, is to gauge the perceptions of investors toward the behavior of investment firms and professionals who are entrusted with their money. The findings should provide a guide for the industry to better serve its clients. We have seen how trust in the industry has evolved over time but also how the essential characteristics of trust endure. Trust must be built over time, yet it can be easily broken. The two major components of trust are credibility and professionalism. Credibility factors can be thought of as observable signals of trust. They are relatively straightforward to identify and provide mental shortcuts to indicate a trustworthy person or organization. Credibility can be demonstrated and earned, but it can also be assigned by a trustworthy source. Please click the link below to get a copy of the 32-page report. No email required. trust.cfainstitute.org/wp-content/uploads/2020/05/CFAI_TrustReport2020_FINAL.pdf  Over the years, we've all heard the doom and gloom from all sorts of so-called market experts. Here's a very short list of some of what you might have heard:
Doom and gloom sound bites make headlines, help sell complex expensive investment products and fit nicely in the 240 character limit on Twitter. But other than that, most of the time they aren't good for much, except for creating fear. There is volatility in the stock market, there is no denying that. And there always will be. Period. In fact, any market where people are involved there will be volatility, but taking a well thought out approach to investing and financial plannning has proven to do very well over time. Volatility and not having absolute certainty about the future is a feature of investing, not a bug. The sooner you get used to it, the better off you'll be. There is always a reason not to invest...do it anyway. Your older wealthier self will thank you. Most people have been accustomed to believing that the more you pay for something the higher the quality to be received. And in many areas of life, this is very well true. You can think of expensive German cars vs. less expensive domestic cars. Step into a high-end department store and get fitted for a custom suit vs. off the rack discount store and you can immediately "feel" the difference. From restaurants, autos, clothes, and electronics, the list goes on and on; pay more, and you can expect to receive a better product or service. Well confusing to most people, this idea does not hold true when it comes to investing. In fact, many times the opposite is true when it comes to investing. Of course the sales literature of the largest financial firms will beg to differ, and the allure of paying for more expensive investment products to get better performance will attract some. Regrettably most investors will not experience this outperformance, but they are guaranteed to experience paying more. The large financial firms that create and sell investment products have created mutual funds, which have by and large been a great benefit to individual investors. A mutual fund at the most basic level is a basket that is created to hold securities. By doing this, it provides diversification to investors by allowing people to buy a basket of securities at one time and removing the risk of owning individual securities (see risk of owning individual securities here). So far so good. Until we dig a bit deeper and get into what can be called the mutual fund share class zoo. These same companies who create these mutual funds, create different share classes that can be sold to different investors. The various share classes are broken down the following way: class A, class B, class C, class I, etc., basically a zoo of letters. These various share classes hold the exact same securities in their basket, so there is no difference in terms of holdings, expected return, and risk. The only difference between these various shares classes is how much money is charged and how much the company and it's advisors are going to make. The equation is simple, the more you pay the less you make and the more your advisor makes. It is essential to consider which class of mutual fund shares is suitable for you. I'll let you in on a secret, shhh, all else being equal, buy the lowest cost option. Below is a chart of the Goldman Sachs Technology Fund and all of it's various share class options. Again, the various mutual funds all hold exactly the same securities, the only difference is the amount of money being charged to own this fund. It's a dramatic difference between the lowest cost share class fund and the highest cost fund. $100,000 invested 10-years ago would be worth anywhere between $542,000 and $484,000. This $58,000 dollar difference is solely due to which shares class your advisor used. Costs matter. Conflicts of Interest Matter. Sadly most financial advisors don't have to use the lowest cost option as these financial advisors will make more money if they use the more expensive option. Yuk. 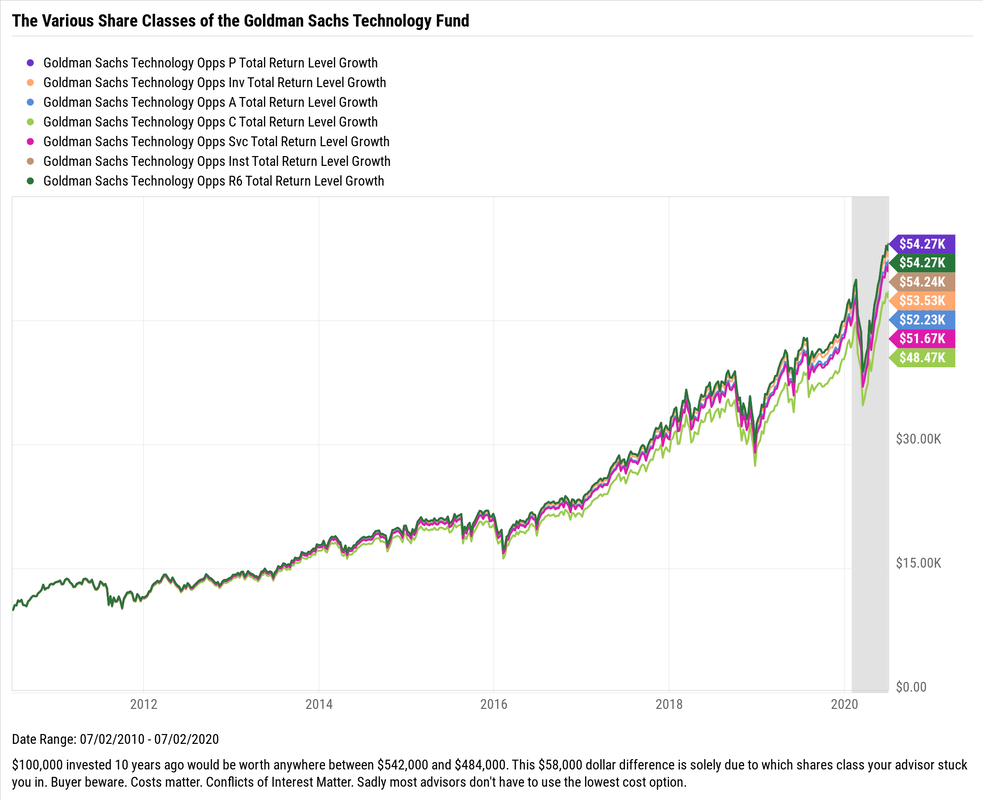 Or if you really want to save money with essentially the same holdings and with historically better performance, the iShares Technology fund (IGM) is an option - see the purple line below. In fact, it's dramatically outperformed all of the Goldman Sachs Technology funds. Of course, past performance is no guarantee of future returns. 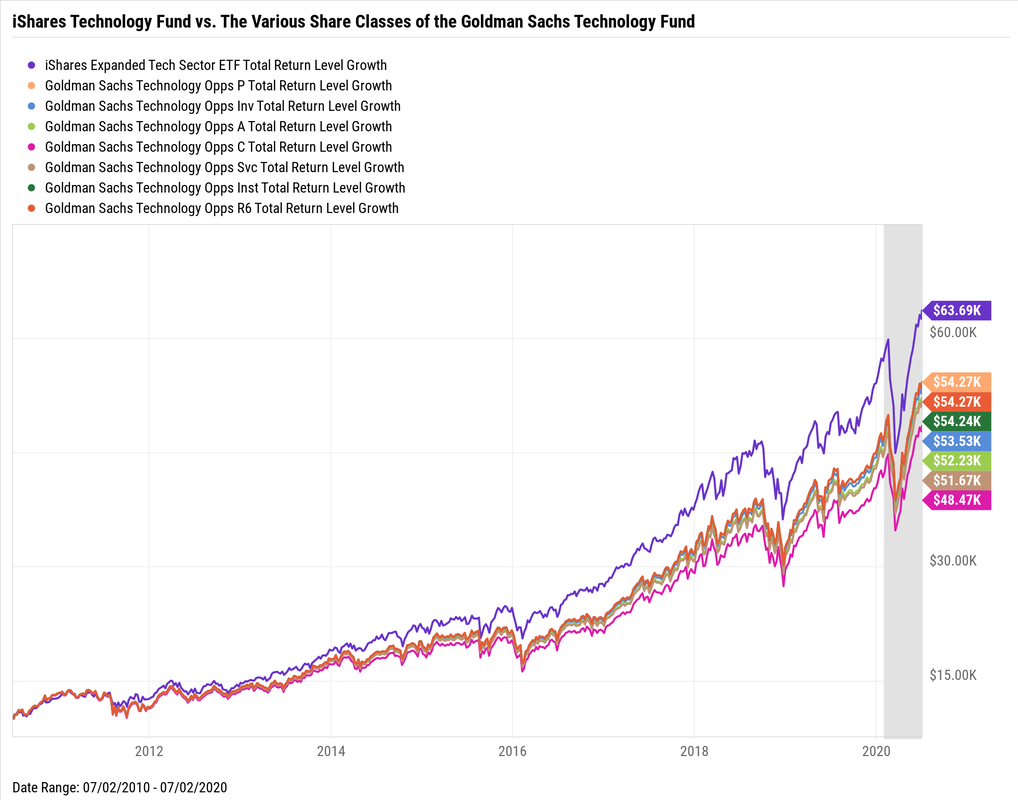 While the technology sector has performed extremely well recently, I use this just as an example of the share classes (and the affect costs have on peformance) many of the large financial firms use and not necessarily promoting technology focused investments right now.
The example above used Goldman Sachs, but this holds true for all the other large financial firms: Morgan Stanley, Wells Fargo, JPMorgan, and Merrill Lynch (Bank of America), just to name a few. They are all guilty of promoting more expensive funds to investors who may not be aware of all the mutual fund share classes. Be careful, It's a zoo out there. There is a reason why the vast majority of individual investors shouldn't own individual stocks. Lots and lots of companies don't do well, in fact, many can make horrible investments and some even go out of business. Buyer beware. Below is a 5-Year Chart of the 11 Worst Performing Stocks in the S&P 500 - while many other companies lost money over this same time period, in fact, 145 were money losers over the last 5-years. Or said another way, almost 1/3 of all companies in the S&P 500 index lost money over the last 5-years! The purple line is the S&P Index over the same time period. Basically over the last 5-years, which includes the current Covid crisis, the stock market is up over 61%, while many companies didn't fair nearly as well. 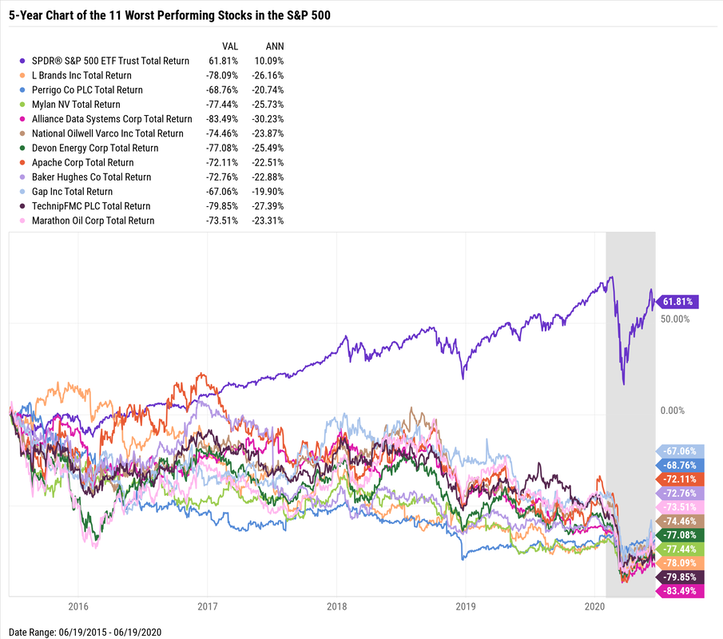 And it gets worse if we look at the Russell 3000 Index, which incorporates somewhat smaller companies that the S&P 500 doesn't include. However, these are still large companies with well-known names. Names like: Macy's, GNC, GoPro, Tupperware, just to name a few. 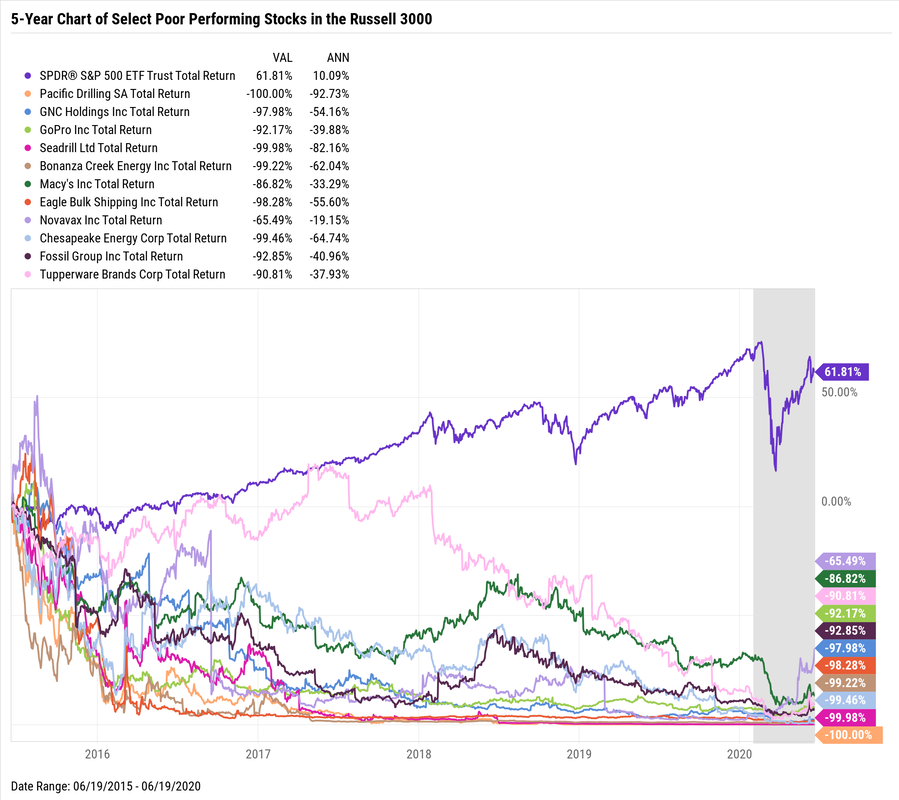 Picking individual stocks isn't easy, nor should it be. This is a highly competitive field, filled with lots of very smart highly skilled professionals who get paid large sums of money to correctly analyze companies and make money for their investors.
Every time you place a trade to buy a company's stock, you should consider who is on the other side of your trade...and what is it that they know, that you don't know? Buyer beware. So, in the spirit of making predictions that will actually come true, here are my Top 10 predictions in order of certainty. In other words, Prediction #10 is pretty-darn-certain to happen while Prediction #1 is absolutely guaranteed.
#10. Volatility will remain The stock market, the bond market, the commodities markets, the geopolitical landscape, pretty much all endeavors where people are involved are volatile – some more than others. This is a feature not a bug. #9. Sectors will rotate The S&P 500 has eleven sectors (technology, financial, real estate, health care, etc.), and guess what? Various sectors fall in and out of favor and therefore their returns will be all over the map. Market prognosticators will give a reason as why this happened...but always after-the-fact. #8. Congress will continue to be a lightning-rod Why? Because 535 people come from all over the country having all different agendas. However, the one agenda they all share is wanting to get reelected. #7. The business media will continue to talk about what the Fed is going to do next Economists enjoy talking about when the Fed is going to lower or raise short-term interest rates. Why? Because it gives people the idea that some so called experts know what the Fed is going to do - the secret is, they don't. Predicting almost anything related to the economy is next to impossible. My advice is to get comfortable being uncomfortable. #6. There will be earnings disappointments Some companies will do worse than expected. Some will even go out of business. Some will disappoint and then surprise in the future. #5. There will be earnings surprises Some companies will do better than expected. Some of these companies will buy other companies. Trying to predict which companies will continue to do well is harder than understanding quantum mechanics. Capitalism is fierce, tread lightly. #4. The housing market will change Mortgage rates, lending standards, building permits, and employment all effect the housing market and these 4 inputs are always changing so it’s nearly impossible for housing not to change. #3. The U.S. dollar will fluctuate Many factors affect the movement of the U.S. dollar and it's virtually impossible to predict the direction, but many will try. Don’t be one of them. #2. Patient long-term investors with a well-thought out plan will do well Past performance of course will not guarantee future results, but it is a pretty-good indication of what the range of outcomes will likely be. #1. My team will continue to serve you in a fiduciary capacity As always, we believe that making decisions based on evidence rather than predictions will give you the best odds of success. Together, we will help plan, build, and execute a financial roadmap that will allow you to live on purpose. And that is one prediction that is absolutely guaranteed. The Coronavirus Bear kicked the 11-year Bull Market of Wall Street very fast. A “bear market” occurs when stock prices in general are falling, and then widespread pessimism sustains the continued drop in prices. The stock market becomes a bear market whenever stock prices have fallen over 20% over the course of several months, as seen in market indexes like the S&P 500. Investors lose confidence in the market as they anticipate further losses.
A “bull market”, on the other hand, comes with rising stock prices and increasing investor confidence. Stock prices rise by at least 20% over the course of several months in a bull market. Looking at history, bear markets are typically shorter than bull markets. A bull market's average duration is about 3 years, while bear markets last on average about 18 months. The terms, “bear market” and “bull market,” come from the behaviors of these animals: A bull thrust its enemies upward, while a bear prefers to knock foes into the dirt. Stock Market Corrections It is important to distinguish a bear market from a market correction, which is shorter and involves less of a market decline. Market corrections are part of the normal ebb and flow of the market. They are short-term trends that typically last less than two months and involve stock market declines of about 10% - not the 20% fall in a bear market. Stock market corrections are a natural part of the stock market cycle. Stock Market Crashes Stock markets “crash” when stock prices plummet more than 10% in one day. The Great Crash of 1929 consisted of market drops of 13% and 12% on successive days. On March 16, 2020, the market crashed 13%. Bear Market Rally In a normal bear market, there will of course be days or weeks when prices increase. It is important, however, to distinguish a bear market rally from the beginning of a bull market. In a rally, the stock market posts gains for days or even weeks in a row. Investors might be tricked into thinking that a new bull market has begun. However, until stock prices increase by 20%, there is still a bear market. Recessions A recession occurs when the Gross Domestic Product (GDP) declines for two or more quarters in a row. Many of the same factors cause recessions and bear markets, but the stock markets and the economy do not always move together. Usually, however, a bear market and a recession overlap. Historical Bear Markets: Great Crash of 1929 (89% drop, 34 months) The depression was preceded by the Great Crash of October, 1929, with price declines of 13% and 12% on successive days. The crash also inaugurated the worst bear market of all time, with stocks dropping 89% through June, 1932. High unemployment lasted through the 1930s. Vietnam & Assassinations of 1968-1970 (36% drop, 18 months) A weakening economy, high inflation, a tumultuous year of assassinations and riots, and tensions of the Vietnam War influenced the development of a bear market, which accompanied a mild recession. Oil Embargo of 1973-1974 (48% drop, 21 months) The 1970s were marked by chronically high inflation. Stocks also underperformed during the decade, rallying and then fading in value. In 1973, the Arab oil embargo drove up gas prices, sparking double-digit inflation, a recession, and a bear market. Interest Rate Rise in 1980-1982 (28% drop, 21 months) By 1980, the country had faced almost a decade of sustained inflation, along with slow growth. In order to fight this “stagflation,” the Federal Reserve raised interest rates. This rate increase, coupled with a deep recession, led to a relatively shallow bear market lasting 21 months. Crash of 1987 (34% drop, 3 months) Due in large part to the excesses of automated computer trading, the market crashed, falling 22.6% in one day. The resulting bear market lasted only a brief 3 months. The GDP did not fall, so there was no recession. Dot.com Bubble of 2000-2002 (49% drop, 30 months) The Dot.com bubble consisted of soaring stock prices and excitement about newly emerging Internet companies. The bubble burst when investors realized that the newly emerging Internet companies showed little or no profit. The attacks of 9/11 deepened a mild recession and prolonged this bear market. Subprime Mortgage & Financial Crisis of 2007-2009 (56% drop, 17 months) A rising mortgage delinquency rate spilled over into the credit markets because a variety of financial instruments were tied to home loans. As a result, the U.S. and other countries enacted large economic stimulus measures. It was accompanied by the “Great Recession.” The Coronavirus of 2020 (30%+ drop, TBD) The pace with which the bear kicked the bull off of Wall Street was startling, as markets were setting record highs as recently as mid-February 2020. In fact, the speed with which the bear awakened from its 11-year slumber was the fastest in history. Volatility was rampant, the NYSE’s circuit breakers kicked on multiple times and the U.S. government rushed through aid packages worth over $1 trillion. A bear market is difficult to predict. Falling stock values might just be part of a stock market correction. Rising values might only signal a bear market rally, as opposed to a new bull market. Investors need to beware of the tendency to overreact to fears of a bear market or thrills of a bull market. Investors tend to tinker with their holdings, often selling after stocks have fallen sharply, instead of buying stocks at low prices (or buying after stocks have risen to unsustainable heights). Similarly, some investors sell stocks before the bear market begins but are then too frightened to return. Many factors affect the stock market. The depression was preceded by the Great Crash of October, 1929, with price declines of 13% and 12% on successive days. The crash also inaugurated the worst bear market of all time, with stocks dropping 89% through June, 1932. High unemployment lasted through the 1930s. The pace with which the bear kicked the bull off of Wall Street was startling, as markets were setting record highs as recently as mid-February 2020. In fact, the speed with which the bear awakened from its 11-year slumber was the fastest in history. Volatility was rampant, the NYSE’s circuit breakers kicked on multiple times and the U.S. government rushed through aid packages worth over $1 trillion. Trends and Predictions Bull markets feature investor optimism, but this turns to pessimism and panic during a bear market. Both bull and bear markets are driven by changes in investor attitudes as much as by economic fundamentals. Target Date Funds have become wildly popular in retirement plans over the last few years, and rightfully so, they help investors who don’t necessarily have a great understanding of investing or don’t have the time, the commitment, nor the energy to put toward researching and understanding how they should be invested. What is a Target Date Fund? It's a prebuilt portfolio that uses one input to determine how to invest your money. What's the one input? The date you expect or plan to retire. That's it. Is this really the best way to plan for your retirement? Probably not, but it's better than having your retirement money sitting in cash or your retirement plan's money market option. Long-term, cash and cash-like investments actually lose their value or purchasing power due to inflation (read here about inflation), so it's important to get your money invested. So Target Date Funds can help people get started in their journey to financial independence if they aren't sure what to do and want to get their feet wet investing. However, to have the highest probably of financial success, the following questions should be addressed and understood prior to making any investment decisions:
While Target Date Funds won't help answer the questions above, they can help people who at least want to get their retirement going and don't know where to start. Generally I agree that picking a Target Date Fund over the default money market option in most retirement plans is a pretty good start, but it’s definitely not the finish line, and quite honestly, it's closer to the starting line. Target Date Funds with the same target date have dramatically different returns over various time. Understanding how these target date funds are invested, what they’re invested in, how often they re-balance and the expenses they charged is critical to understand. Why? Well, this will determine how your portfolio will do overtime and how much money your portfolio may be worth in 10, 20, or 30 years in the future. Take a look at two charts below of many well-known Target Date Funds that all supposedly have the same retirement date. Notice the difference between returns and how volatile various target date funds can be even with the same retirement date of 2030. The below chart shows several 2030 Target Date Funds and how they faired during this recent downturn. They ranged from being down as little as -22% to down over -28% from their recent highs. 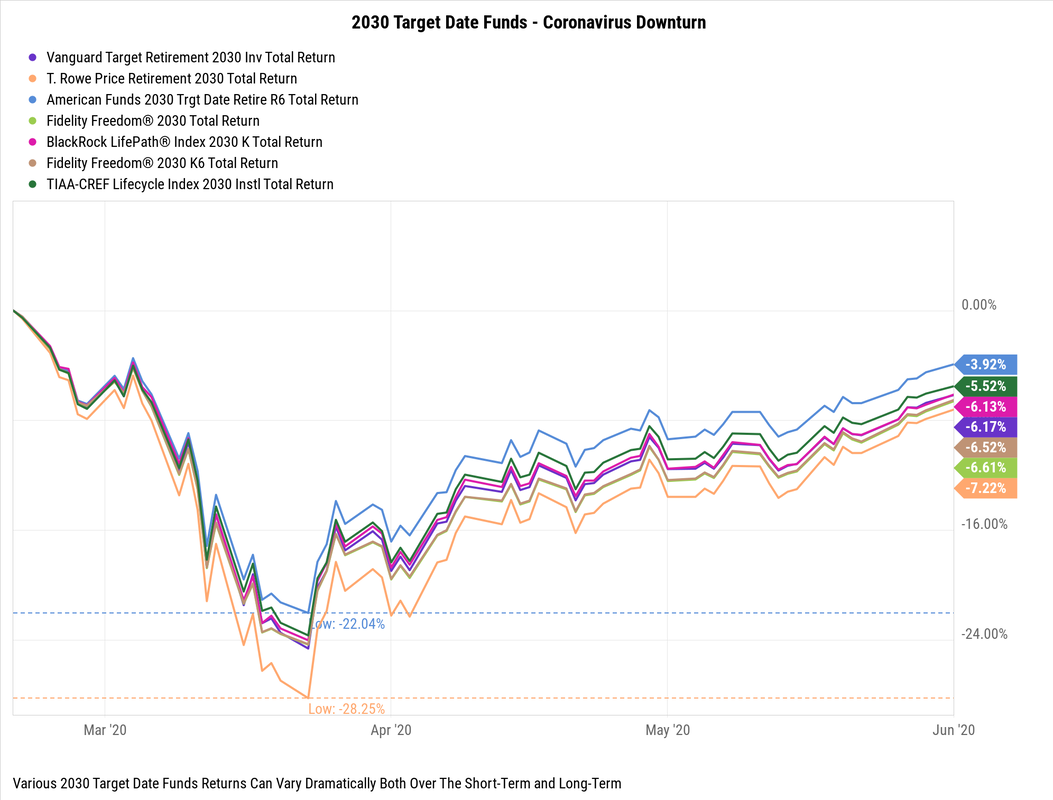 The chart below shows the 10-Year return of these same seven 2030 Target Date Funds. The returns differences are staggering, if you had invested $100,000 10-year ago your value today would have ranged from $178,000 to over $211,000 depending which Target Date Fund you might have been invested in. 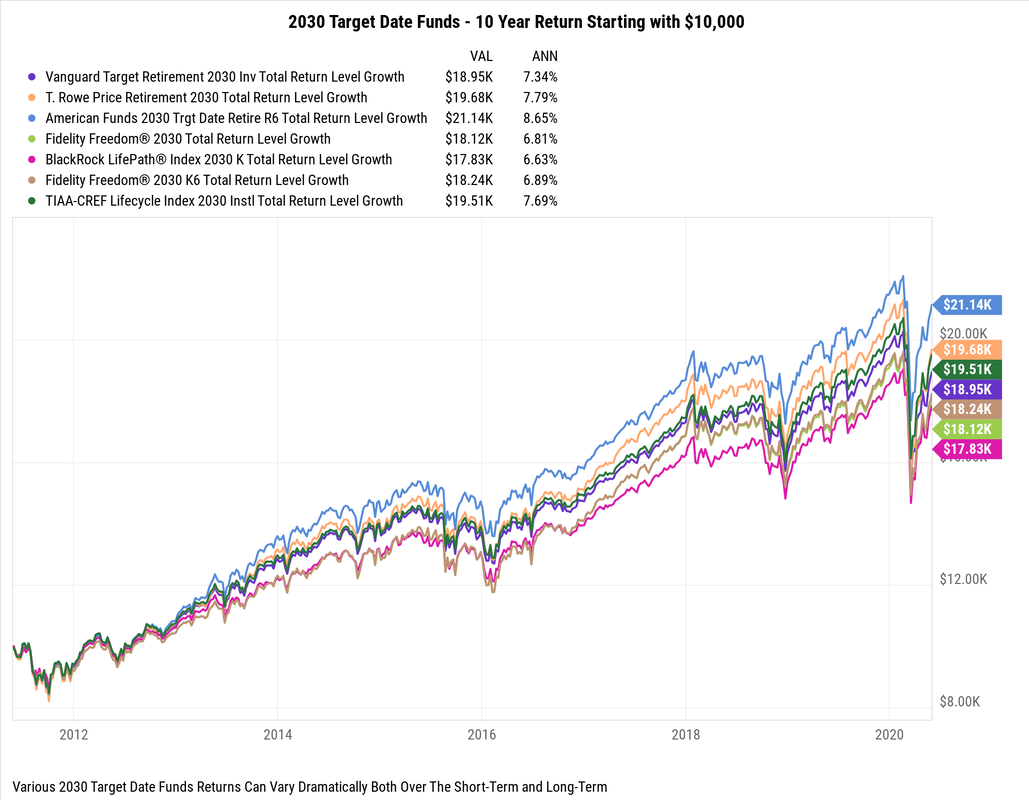 Having a well-though financial plan, understanding what you are invested in (research, research, research & more research), and recognizing not all Target Date Funds are created equal is important to meeting your financial goals.
The Coronavirus Bear kicked the 11-year Bull Market of Wall Street very fast. A “bear market” occurs when stock prices in general are falling, and then widespread pessimism sustains the continued drop in prices. The stock market becomes a bear market whenever stock prices have fallen over 20% over the course of several months, as seen in market indexes like the S&P 500. Investors lose confidence in the market as they anticipate further losses.
A “bull market”, on the other hand, comes with rising stock prices and increasing investor confidence. Stock prices rise by at least 20% over the course of several months in a bull market. Looking at history, bear markets are typically shorter than bull markets. A bull market's average duration is about 3 years, while bear markets last on average about 18 months. The terms, “bear market” and “bull market,” come from the behaviors of these animals: A bull thrust its enemies upward, while a bear prefers to knock foes into the dirt. Stock Market Corrections It is important to distinguish a bear market from a market correction, which is shorter and involves less of a market decline. Market corrections are part of the normal ebb and flow of the market. They are short-term trends that typically last less than two months and involve stock market declines of about 10% - not the 20% fall in a bear market. Stock market corrections are a natural part of the stock market cycle. Stock Market Crashes Stock markets “crash” when stock prices plummet more than 10% in one day. The Great Crash of 1929 consisted of market drops of 13% and 12% on successive days. On March 16, 2020, the market crashed 13%. Bear Market Rally In a normal bear market, there will of course be days or weeks when prices increase. It is important, however, to distinguish a bear market rally from the beginning of a bull market. In a rally, the stock market posts gains for days or even weeks in a row. Investors might be tricked into thinking that a new bull market has begun. However, until stock prices increase by 20%, there is still a bear market. Recessions A recession occurs when the Gross Domestic Product (GDP) declines for two or more quarters in a row. Many of the same factors cause recessions and bear markets, but the stock markets and the economy do not always move together. Usually, however, a bear market and a recession overlap. Historical Bear Markets: Great Crash of 1929 (89% drop, 34 months) The depression was preceded by the Great Crash of October, 1929, with price declines of 13% and 12% on successive days. The crash also inaugurated the worst bear market of all time, with stocks dropping 89% through June, 1932. High unemployment lasted through the 1930s. Vietnam & Assassinations of 1968-1970 (36% drop, 18 months) A weakening economy, high inflation, a tumultuous year of assassinations and riots, and tensions of the Vietnam War influenced the development of a bear market, which accompanied a mild recession. Oil Embargo of 1973-1974 (48% drop, 21 months) The 1970s were marked by chronically high inflation. Stocks also underperformed during the decade, rallying and then fading in value. In 1973, the Arab oil embargo drove up gas prices, sparking double-digit inflation, a recession, and a bear market. Interest Rate Rise in 1980-1982 (28% drop, 21 months) By 1980, the country had faced almost a decade of sustained inflation, along with slow growth. In order to fight this “stagflation,” the Federal Reserve raised interest rates. This rate increase, coupled with a deep recession, led to a relatively shallow bear market lasting 21 months. Crash of 1987 (34% drop, 3 months) Due in large part to the excesses of automated computer trading, the market crashed, falling 22.6% in one day. The resulting bear market lasted only a brief 3 months. The GDP did not fall, so there was no recession. Dot.com Bubble of 2000-2002 (49% drop, 30 months) The Dot.com bubble consisted of soaring stock prices and excitement about newly emerging Internet companies. The bubble burst when investors realized that the newly emerging Internet companies showed little or no profit. The attacks of 9/11 deepened a mild recession and prolonged this bear market. Subprime Mortgage & Financial Crisis of 2007-2009 (56% drop, 17 months) A rising mortgage delinquency rate spilled over into the credit markets because a variety of financial instruments were tied to home loans. As a result, the U.S. and other countries enacted large economic stimulus measures. It was accompanied by the “Great Recession.” The Coronavirus of 2020 (30%+ drop, TBD) The pace with which the bear kicked the bull off of Wall Street was startling, as markets were setting record highs as recently as mid-February 2020. In fact, the speed with which the bear awakened from its 11-year slumber was the fastest in history. Volatility was rampant, the NYSE’s circuit breakers kicked on multiple times and the U.S. government rushed through aid packages worth over $1 trillion. Trends and Predictions Bull markets feature investor optimism, but this turns to pessimism and panic during a bear market. Both types of markets are driven by changes in investor attitudes as much as by economic fundamentals. A bear market is difficult to predict. Falling stock values might just be part of a stock market correction. Rising values might only signal a bear market rally, as opposed to a new bull market. Investors need to beware of the tendency to overreact to fears of a bear market or thrills of a bull market. Investors tend to tinker with their holdings, often selling after stocks have fallen sharply, instead of buying stocks at low prices (or buying after stocks have risen to unsustainable heights). Similarly, some investors sell stocks before the bear market begins but are then too frightened to return. Many factors affect the stock market. The depression was preceded by the Great Crash of October, 1929, with price declines of 13% and 12% on successive days. The crash also inaugurated the worst bear market of all time, with stocks dropping 89% through June, 1932. High unemployment lasted through the 1930s. The pace with which the bear kicked the bull off of Wall Street was startling, as markets were setting record highs as recently as mid-February 2020. In fact, the speed with which the bear awakened from its 11-year slumber was the fastest in history. Volatility was rampant, the NYSE’s circuit breakers kicked on multiple times and the U.S. government rushed through aid packages worth over $1 trillion. Trends and Predictions Bull markets feature investor optimism, but this turns to pessimism and panic during a bear market. Both bull and bear markets are driven by changes in investor attitudes as much as by economic fundamentals. |